
The Amazon Inventory Performance Index (IPI) score determines your limits on storage and operational capacity in Fulfillment by Amazon. The IPI score is a measure of how well you are managing your inventory stored in Amazon’s fulfillment network.
If the IPI score is below the minimum threshold, your storage limit and operational capacity may be restricted, or possibly your operations stopped altogether. The Amazon IPI score is rated on a scale of 0-1,000.
Update for 2026
The minimum threshold is currently 400 points (reduced from 450 in previous years), however, Amazon can change this number every quarter, given the changing demand and the capacity at their fulfillment centers. If your score is below this threshold, you will have storage volume restrictions that do not allow you to send in any new inventory, even if they are your bestsellers, during peak season.
The IPI system is designed to fulfill Amazon’s operational objectives. The IPI focuses on warehouse efficiency, quickly turning inventory, and optimum use of warehouse space. Your score is a reflection of how well your inventory practices fit in with these objectives.
There are four parameters that Amazon measures: excess inventory percentage, sell-through rate, stranded inventory, and in-stock rate of your top-selling products. When these metrics are combined, they will determine if you will have no storage access at all or limited storage capacity.
This guide is everything you need to manage IPI scores in totality for Amazon sellers. You will understand the calculation of your score, the factors that influence your score’s impact, and strategies to keep your score high enough to meet the necessary level.
The content presents both baseline concepts and practical optimization strategies so that you can start implementing strategies right away, even if you are addressing an urgent score situation or building more sophisticated inventory management processes on a go-forward basis.
You will be able to grow your Amazon business if you feel comfortable with the requirements associated with inventory performance.
What Is Amazon’s Inventory Performance Index?
The Inventory Performance Index (IPI) is a comprehensive metric developed by Amazon to evaluate your effectiveness in managing Fulfilled by Amazon (FBA) inventory.
In a nutshell, simply picture it as a score for how well you are complying with their inventory management score guide, on a scale from 0 to 1000, and your IPI score can have an impact on your ability to store and sell an item while using the Amazon fulfillment network.
Amazon developed this IPI system to encourage sellers to keep items moving via a reasonably healthy sell-through rate, to reduce excess stock, and to keep items in stock for buyers’ potential purchases an approach that has become even more important following Amazon’s December 2025 updates.
Your IPI is not merely a “vanity” metric, but it acts as a gatekeeper for your access to unlimited storage or for restrictions that could limit your business’s growth.
Understanding Score Ranges: Where Do You Stand?
According to Amazon’s own communications to sellers, most sellers have an IPI between 400 and 800.. Industry experts consider 550+ as a good IPI score that demonstrates mastery of warehouse planning. Here’s what different score ranges mean for your business:
| IPI Score Range | Status | Storage Access | Business Impact |
|---|---|---|---|
| 800+ | Optimal | Unlimited storage | Maximum growth potential |
| 550-799 | Good standing | Standard capacity | Strong operational efficiency |
| 400-549 | Adequate | Standard capacity | Room for improvement |
| Below 400 | Poor performance | Restricted limits | Growth severely limited |
| Below 350 | Critical | Severe restrictions | Emergency action required |
When your score drops below the threshold, the consequences multiply quickly:
- You can’t send more inventory to the best-selling products
- Amazon imposes strict limits on the total volume of warehouses
- Your products sell out, and momentum dies
- Organic ranking suffers due to availability
- Account health metrics trend downward
Low IPI means Amazon interprets you are not managing your inventory efficiently, and while Amazon doesn’t say IPI affects Buy Box eligibility directly, many sellers find a relationship between improving the IPI score and an increased percentage of time with the Buy Box.
How to Find Your IPI Score in Seller Central
Before you can improve your score, you need to know where to find it. Amazon provides multiple access points to your IPI dashboard:
Method: Quick Dashboard View
- Log in to your Amazon Seller Central account
- Look to the top right corner of your homepage
- You’ll see “IPI” displayed next to the “Total Balance” box
- Hover over the dropdown to see your score for each marketplace you sell in
- Click the hyperlinked IPI number to access your detailed Inventory Performance Dashboard
Inventory → Manage FBA Inventory → Inventory Dashboard → Performance Tab
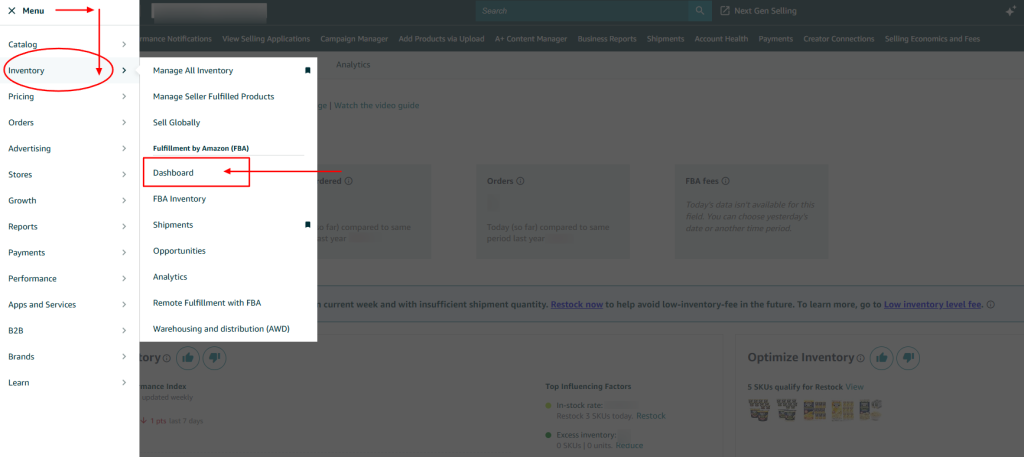
The Performance Dashboard provides not just your overall score but detailed insights into each of the four pillars affecting your IPI.
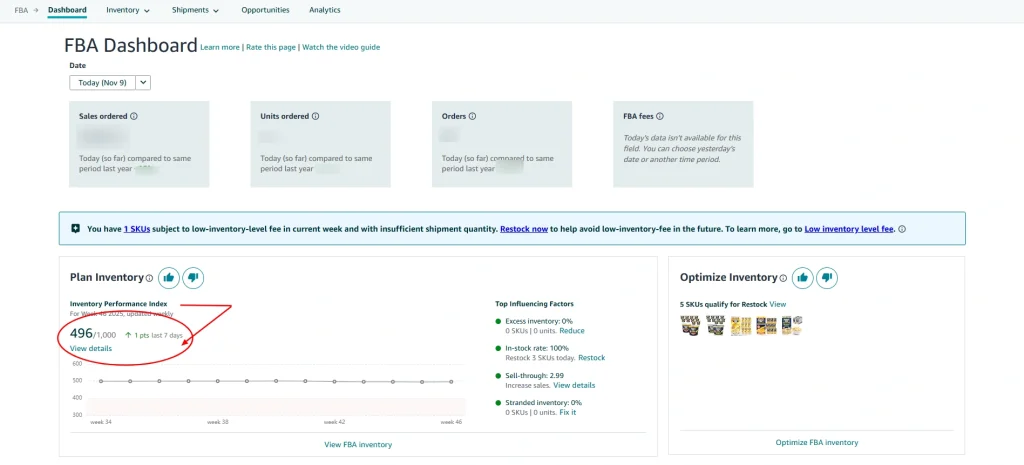
The IPI Calculation: What Amazon Won’t Tell You
The critical truth every seller needs to understand: Amazon does not publish the exact formula for calculating IPI scores.
According to Amazon’s official statements to sellers: “The calculation is proprietary and will not be published, just as we do not publish the Buy Box algorithm.”
However, to improve the Amazon IPI score, we do know the individual metric formulas and the approximate weighting based on extensive seller observations and testing.
Known Individual Metric Formulas
Sell-Through Rate:
Sell-Through Rate = Units Sold/Shipped (Past 90 Days) ÷ Average Units Available at Fulfillment Centers (Past 90 Days)
Example: If you sold 300 units while maintaining an average of 100 units in stock, your sell-through rate is 3.0.
Excess Inventory Percentage
Products are flagged as “excess” when you have more than 90 days’ supply based on Amazon’s sales forecasts compared to your current stock levels.
Stranded Inventory Percentage
The percentage of your FBA inventory units that are currently not available for purchase on Amazon (due to listing errors, policy violations, or other issues).
In-Stock Rate
Calculated for products that generated sales on at least 30 out of the past 60 days, measuring how consistently you maintain inventory availability.

Estimated Metric Weighting
Based on extensive seller testing and observations across thousands of accounts, the approximate weighting appears to be:
- Excess inventory: 40-45% of total score
- Sell-through rate: 30-35% of total score
- Stranded inventory: 15-20% of total score
- In-stock rate: 10-15% of total score
While Amazon hasn’t confirmed these exact percentages, seller data consistently shows that excess inventory and sell-through rate have the most significant impact on score changes.
4 Pillars of Your IPI Score

Amazon calculates your IPI score using four key metrics. Each measures a different aspect of inventory efficiency, and understanding these pillars helps you prioritize optimization efforts.
Excess Inventory Percentage
This is where most of your score is calculated from, roughly around 40-45% of the total. Amazon marks inventory as “excess inventory” when you have more than 90 days of supply using Amazon’s forecasted sales reporting.
You want to keep your excess inventory percentage below 10% of total inventory value, while top sellers keep using the same standard below 5%. Both of these percentages also impact your IPI score, and if you go over either, a storage fee reduces your profit margin as well.
Storage fees also get more expensive every month for older inventory from 271 days and beyond. Additionally, it becomes worse because the surcharge for older inventory can exceed the wholesale value of that item as well. Your inventory can no longer be an asset and can now be a liability instead.
Sell-Through Rate
This metric assesses how fast you are turning inventory into sales. Amazon computes this value by dividing the units sold over the past 90 days by the average units in stock for the past 90 days. This factor alone counts for about 30-35% of your IPI score.
Target benchmarks for sell-through rate:
- Minimum acceptable: 3.0
- Good performance: 4.0-5.0
- Excellent performance: 6.0+
- Top performers: 7.0+
What top sellers do differently
The highest-performing Amazon sellers maintain at least 6 inventory turns per year to avoid excessive fees and restock limitations.10 They only send in enough inventory to last one to two months maximum, which naturally keeps their sell-through rates in the optimal range.10
If you sold 300 units while maintaining an average of 100 units in stock, your sell-through rate is 3.0. The faster you turn inventory, the better your score becomes.
Stranded Inventory
Stranded inventory refers to inventory that’s stored in Amazon’s warehouses but not available for sale. This number is overemphasized – about 15-20% – because stranded means completely wasted to Amazon.
| Common Stranding Causes | Detection Method | Typical Fix Timeline |
|---|---|---|
| Missing product info | Stranded Inventory report | 1-3 days |
| Policy violations | Account Health page | 1-14 days |
| Expired category approvals | Selling application status | 1-7 days |
| IP complaints | Intellectual property claims | 7-30 days |
| Technical catalog errors | System alerts | 1-5 days |
You should be aiming to achieve a 0% stranded inventory at all times; a unit that is sitting stranded each day impacts your IPI score negatively and is incurring storage fees for no sales.
Top seller practice
The most successful sellers monitor their stranded inventory report weekly and fix issues within 24-48 hours. They also clean out their inventory every month, removing any products that show signs of becoming problems before they impact the IPI score.10
In-Stock Rate
This measures how frequently you have inventory in stock for your best-selling products. Amazon considers “best seller” to mean products that generated sales on at least 30 days out of the last 60 days. This counts for about 10-15% of your overall score.
Performance targets you should aim for:
- Minimum requirement: 90%
- Recommended target: 95%
- Optimal performance: 97%+
Interestingly, the in-stock rate is actually the lowest weighted metric of all four. Amazon cares more about your overall inventory efficiency than perfect availability. A seller with a 93% in-stock rate and an excellent sell-through rate will score higher than a seller with a 99% in-stock rate and too much inventory.
How Amazon Calculates Your IPI Score
The IPI score is updated by Amazon once a week, on a Tuesday morning typically, Pacific Time. The new number is visible in your Inventory Performance Dashboard, but what you see as a score is an actual score reflecting inventory performance for the rolling past 90 days.
Which means, the actions you take today will not impact your current score immediately, they are looking at your IPI score as an ongoing, longer-term perspective over time.
For example, if you did a removal today, those units will average down your inventory level as you roll into the next day, to 90 days later.
The quarterly evaluation will happen on a date likely 6 weeks before the quarter ends.
For example, if the quarter ends on March 31, Amazon will probably evaluate your IPI score at some point in mid-February.
This is the timing that you will want to know because the whole purpose behind wanting to know about your IPI score is to have the best score possible. Concerns for your score will become more concerning long before the end-of-quarter deadline.
FBA vs FBM – Strategic Fulfillment Choices

Your fulfillment method has a significant effect on your IPI score, as only FBA inventory is part of your IPI. Products you fulfill through FBM do not count toward any of the four categories in the IPI score
There are obvious benefits to using FBA. You receive Prime eligibility, which instantly improves your conversion rate. Amazon handles customer service, returns, and shipping delays for your product on FBA orders. As an FBA seller, your product indexes better in searches as the algorithm favors FBA products.
| Fulfillment Method | IPI Impact | Best Use Cases | Key Drawbacks |
|---|---|---|---|
| FBA | Affects all four metrics directly | Fast movers, predictable demand | Storage fees, IPI risk |
| FBM | Zero impact on IPI score | Slow movers, oversized items | No Prime, you handle logistics |
| Hybrid Model | Strategic control over metrics | Balanced portfolio management | Operational complexity |
FBM makes strategic sense for several product categories:
- Slow-moving items with sell-through rates below 2.0
- Oversized products with expensive FBA fees
- Products you’re testing before full FBA commitment
- Seasonal items outside their peak selling season
- Products with unpredictable demand patterns
The hybrid model strategically incorporates both fulfillment methods. Your top movers will be FBA, so you maximize sales velocity and gain Prime customer preference. Slower movers will be FBM so that you have inventory to protect your IPI score while still maintaining availability.
Decision framework for product allocation:
- Analyze each product’s sell-through rate quarterly
- If the rate falls below 2.0 for two consecutive quarters, switch to FBM
- If the FBM product shows consistent sales 30+ days out of 60, move to FBA
- Review and adjust allocations every 90 days
This dynamic allocation means your FBA inventory will be made up entirely of items that will not harm your IPI score. The operational discipline to continually reallocate inventory will pay dividends in sustained high IPI scores and storage capacity without any limits.
Advanced Strategies for IPI Optimization
Beyond basic fulfillment choices, you can implement several advanced strategies to maintain optimal IPI scores year-round.
Small-Batch Replenishment Strategy
Rather than placing big orders for many items to get the per-unit price lower, you will activate the strategy of smaller orders made more often instead. Smaller orders will keep your average inventory management tools level low, and it will really improve your sell-through.
The math works here because IPI scores are about averages, not raw volume units sold. If I sell 300 units a month and keep 100 in stock, my sell-through will be 3.0. If I keep 50 in stock and reorder twice monthly, my sell-through will be 6.0.
Benefits of small-batch replenishment:
- Significantly improved sell-through rates
- Reduced storage fee expenses
- Lower risk of excess inventory flags
- Decreased capital tied up in inventory
- Greater flexibility to respond to demand changes
Preemptive Promotional Tactics
Launch promotions before Amazon flags inventory as excess. When you notice a product’s sell-through rate declining or inventory levels creeping toward 90+ days of supply, implement discounts immediately.
| Inventory Age | Recommended Action | Discount Range | Urgency Level |
|---|---|---|---|
| 60-75 days supply | Launch coupons, increase PPC | 10-15% | Medium |
| 75-85 days supply | Run promotions, consider Lightning Deals | 20-25% | High |
| 85+ days supply | Aggressive discounts or removal | 30%+ | Critical |
Lightning Deals work particularly well for aged inventory because they create urgency and dramatically increase visibility. Submit Lightning Deal requests 4-6 weeks before you need them to account for Amazon’s review process.
Product Lifecycle Management System
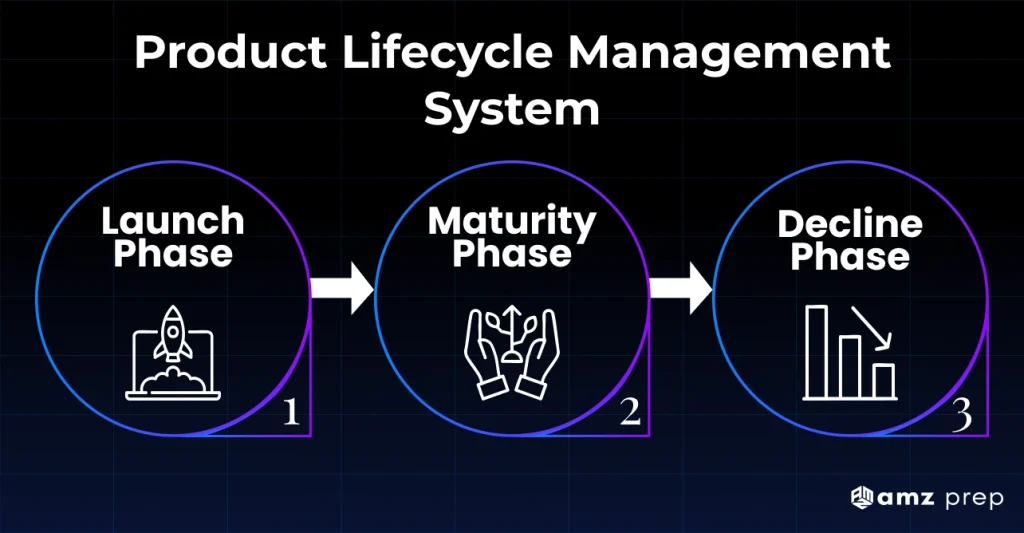
Every product moves through distinct lifecycle phases, and each requires different inventory strategies. Understanding where each product sits helps you make smart IPI decisions before problems emerge.
Launch phase strategy:
- Start with conservative initial orders
- Order only 30-45 days of estimated sales
- Accept potential stockouts over excess inventory risk
- Validate demand via web scraping before committing to larger orders.
Maturity phase management:
- Implement small-batch replenishment
- Maintain sell-through rates above 4.0
- Keep in-stock rates above 95%
- Monitor weekly for any metric degradation
Decline phase exit planning:
- Stop reordering when sales decline for three consecutive months
- Let inventory naturally deplete
- Implement aggressive liquidation if the decline accelerates
- Create removal orders before excess inventory flags appear
Your system should include monthly reviews asking three questions: Is sales velocity increasing, stable, or decreasing? What’s the current inventory position relative to sales velocity? Does the fulfillment method need adjustment?
Inventory Segmentation: ABC Analysis

The Pareto Principle applies directly to Amazon selling, roughly 20% of your products generate 80% of your sales. These products deserve different inventory management rules than your long-tail catalog.
Product tier classifications:
- A Products (Top 20%): Your best performers require constant availability
- B Products (Middle 30%): Steady sellers needing regular monitoring
- C Products (Bottom 50%): Slow movers requiring strict inventory limits
| Product Tier | Fulfillment Method | Target Stock Level | Reorder Frequency | In-Stock Priority |
|---|---|---|---|---|
| A Products | FBA | 45-60 days | Weekly/bi-weekly | 99%+ |
| B Products | FBA | 30-45 days | Bi-weekly/monthly | 95%+ |
| C Products | FBM or minimal FBA | 15-30 days | Monthly/as-needed | 85%+ acceptable |
For “A” products, hold enough safety stock to achieve a 99% in-stock rate, as stockouts can be very costly to your revenue stream. Accept a bit more inventory in this case, as these products move through sufficiently quickly to maintain strong sell-through rates.
For “C” products, apply just-in-time inventory or FBM fulfillment services method to keep things moving. The IPI risk outweighs the Prime benefit when it comes to slow-moving stuff. A common mistake among sellers is applying the same thought to all SKUs, which leads to stockouts on the winners and excess stock on the losers.
Resource allocation framework:
- Spend 60% of inventory management time on A products
- Allocate 30% of the time to B products
- Dedicate only 10% to C products
What Top Sellers Do Differently: Proven Practices from High Performers
The sellers who consistently maintain IPI scores above 700 follow a disciplined approach that differs significantly from average sellers. Here’s what sets them apart:
Weekly Monitoring Discipline
Top performers don’t wait for quarterly evaluations to panic. They check their IPI score every Tuesday morning when it updates and track their performance over time. They treat IPI monitoring like checking their bank account; it’s a non-negotiable weekly ritual.
Monthly Inventory Audits
High-performing sellers conduct comprehensive inventory reviews every 30 days. They identify products trending toward excess inventory status, address slow-moving SKUs before they become problems, and make proactive fulfillment method switches when sell-through rates decline.10
Conservative Restocking Philosophy
The most successful sellers follow this rule: Only send in enough inventory to last one month, two at the most.
While this might seem overly conservative, it ensures sell-through rates remain in the optimal 6.0+ range. They’ve accepted that slightly higher per-unit costs from more frequent reordering are offset by:
- Lower storage fees
- No excess inventory penalties
- Unlimited storage capacity
- Better cash flow management
- Greater flexibility to respond to market changes
Immediate Action on Stranded Inventory
When inventory becomes stranded, top sellers fix it within 24-48 hours. They don’t let stranded units accumulate. If a fix isn’t immediately available, they create removal orders to stop the IPI damage, even if it means temporarily losing inventory availability.
Proactive Excess Inventory Management
Rather than waiting for Amazon to flag inventory as excess (90+ days supply), top sellers take action when inventory reaches 60 days supply. They launch promotions early, adjust pricing strategically, and aren’t emotionally attached to products that aren’t performing.
Emergency IPI Recovery Protocol
When your score drops dangerously close to the threshold with a quarterly evaluation approaching, you need quick-win tactics. This emergency protocol can raise your score by 50-100 points in 7-14 days.
Immediate actions for emergency recovery:
- Day 1-2: Identify and fix all stranded inventory immediately
- Day 3-4: Create removal orders for inventory with 120+ days of supply
- Day 5-6: Launch aggressive promotions on items with 90+ days of supply
- Day 7: Submit Lightning Deal requests for aged inventory
- Day 8-14: Monitor daily score updates and adjust tactics
| Action Type | Expected Score Impact | Implementation Speed | Cost Consideration |
|---|---|---|---|
| Fix stranded inventory | +20-40 points | 1-3 days | Minimal |
| Remove excess inventory | +30-60 points | 3-7 days | Removal fees |
| Aggressive promotions | +10-30 points | 7-14 days | Margin reduction |
| Switch products to FBM | +20-50 points | 5-10 days | Loss of Prime badge |
Have realistic expectations for emergency recovery. If you have a score of 380, and the evaluation is in two weeks, you are not going to get to a score of 450 in time. Instead, focus on showing that you are getting better, which is all you need to do in preparation for the next evaluation for next quarter.
The emergency protocol should be the last option, not the norm for your strategy. Sellers who have scores above 600 at all times never need emergency tactics because they have systems in place to avoid IPI problems in advance.
Conclusion
Your IPI score controls how much inventory you can store and how fast you can grow with Amazon FBA. Focus on the four pillars, excess inventory, sell-through rate, stranded inventory, and in-stock rate, to keep scores above 400 (ideally 550+).
Successful sellers track scores weekly, send only 1–2 months of stock, maintain six turns per year, and clear excess inventory monthly. Use small-batch replenishment, hybrid fulfillment, and timely promotions to stay efficient.
Check your Inventory Performance Dashboard often, resolve stranded items fast, and keep excess inventory under 10% to avoid storage limits and maintain steady growth during peak seasons.
FAQs
How often does Amazon update my IPI score?
Amazon updates your IPI score weekly, typically every Tuesday morning Pacific Time. However, your score reflects your performance over the previous 90 days, so improvements take time to show. Don’t expect overnight changes—consistent good practices compound over three months.u003cbru003e
Can I improve my IPI score in less than 30 days before the quarterly evaluation?
Partially, yes. While your score reflects 90-day performance, you can see movement in 7-14 days by fixing stranded inventory and creating removal orders for excess stock. However, dramatic improvements require sustained effort over 60-90 days. Amazon evaluates your score six weeks before quarter-end, so start early.u003cbru003e
Does removing inventory to improve my IPI score hurt my sales?
It depends on which products you remove. If you’re removing slow-moving inventory with sell-through rates below 2.0, the sales impact is minimal. Calculate the opportunity cost: if storage fees and IPI restrictions cost more than potential sales from that inventory, removal is the right choice.
Will switching products to FBM hurt my conversion rates significantly?
Yes, most products see 20-40% lower conversion rates without Prime eligibility. However, for products with sell-through rates below 2.0, keeping them in FBA hurts your overall business more through IPI score damage. Reserve FBA for your best performers and use FBM strategically for slower movers.
What happens if my IPI score drops below 400 during the quarter, but recovers before evaluation?
If your score is above 400 at the evaluation checkpoint (approximately six weeks before quarter-end), you’re safe for that quarter. Amazon doesn’t penalize you for mid-quarter dips. However, consistent volatility suggests underlying inventory management problems you should address.
How do returns affect my IPI score?
Returns impact your sell-through rate calculation. When customers return products, those units increase your average inventory level without contributing to u0022units sold,u0022 which can lower your sell-through rate. High return rates in specific categories (like apparel) make IPI management more challenging.u003cbru003e
Can I have a good IPI score with poor sales?
Yes, absolutely. IPI measures inventory efficiency, not sales volume. A seller with $10,000 monthly revenue can have a higher IPI score than a seller with $100,000 monthly revenue if they manage inventory more efficiently. However, you need sales in at least 30 of the past 60 days to maintain good in-stock rates for your best-sellers.u003cbru003e
Does Amazon’s Restock Inventory tool recommendation help or hurt my IPI score?
It can hurt if followed blindly. Amazon’s recommendations optimize for availability, not IPI health. They often suggest larger quantities than necessary, especially for products with variable demand. Use their suggestions as one data point, but reduce quantities by 25-40% for products with historical variability.u003cbru003e
What’s the fastest way to fix stranded inventory?
First, check your Stranded Inventory report in Seller Central (accessible through the Inventory Performance Dashboard) to identify the specific issue. Most common fixes include updating missing product attributes, resolving policy violations, or renewing category approvals. If you can’t fix it within 48 hours, create a removal order to stop the IPI damage immediately.u003cbru003e
Should I use Amazon Warehousing u0026amp; Distribution (AWD) to improve my IPI score?
Yes, AWD is one of the best tools for IPI optimization. Inventory in AWD doesn’t count toward your IPI score, and Amazon automatically replenishes your FBA inventory from AWD stock. You maintain availability without excess inventory penalties. The lower storage costs ($0.24 per cubic foot vs. $0.87-$2.40 for FBA) make it financially attractive, too.
How do seasonal businesses manage IPI scores during off-seasons?
Successful seasonal sellers shift products to FBM during off-seasons, use AWD for bulk storage, or liquidate remaining inventory before the slow period. Plan your post-season inventory drawdown during peak season. Don’t wait until January to deal with excess holiday inventory; start promotions in late November and December.
Can I appeal Amazon’s IPI threshold or storage limits?
No, IPI thresholds and storage limits are system-wide and non-negotiable. Amazon doesn’t grant exceptions based on individual circumstances. Your only option is improving your score through better inventory management. Focus on what you can control: the four metrics that determine your score.
Does IPI scoring differ by product category?
No, Amazon applies the same IPI calculation method across all product categories. Whether you sell electronics, toys, apparel, or home goods, the four pillars (excess inventory, sell-through rate, stranded inventory, and in-stock rate) are weighted identically. However, some categories naturally have different inventory dynamics; for example, apparel typically has higher return rates, which can make maintaining optimal sell-through rates more challenging.
What’s a realistic target IPI score for a growing business?
Most Amazon sellers fall between 400 and 800.u003csupu003e2.u003c/supu003e If you’re maintaining a score of 550+, you’re demonstrating solid warehouse planning and inventory management.u003csupu003e3u003c/supu003e Scores above 700 indicate excellent practices that position you for unlimited growth. Focus on consistent improvement rather than perfection; a steady 600 is better than volatile swings between 450 and 750.u003cbru003e

Arishekar N is a Vice President (VP) of Marketing at AMZ Prep, specializing in ecommerce fulfillment and Amazon logistics strategies with a proven track record of driving growth for e-commerce businesses. He is a strategic leader with extensive expertise in marketing, e-commerce operations, SEO & advertising, and branding.
Stay updated on his latest insights by following him

















Comments