
You are spending lots of money on Amazon ads, refining your listings, and keeping tabs on competitors whose listings somehow outrank yours even when their products appear to be weaker on paper.

This is a challenge people are facing with increasing frequency in today’s marketplace. Amazon’s ranking algorithm has become a complex decision engine that factors in much more than just a product’s keywords and sales spike.
This document explains the mechanics of Amazon’s modern ranking system and the factors on the seller side that others often overlook.
You will also find some practical, data-backed strategies in alignment with how the algorithm processes actual product performance and search visibility.
The information you are about to read speaks to observable behaviors across different categories, seller profiles, and marketplace behavior, and will offer you some enhanced clarity into what actually moves the rank needle in today’s environment.
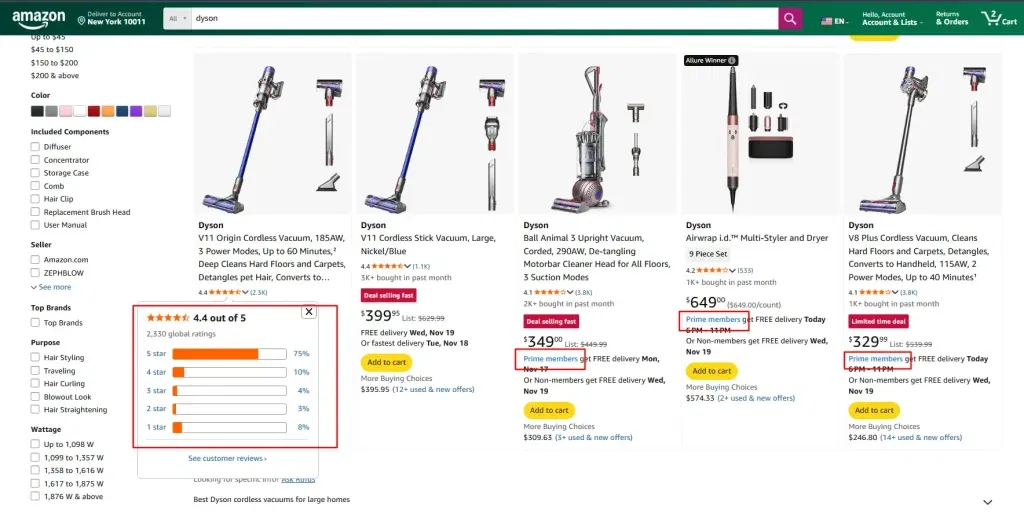
Overview of How Amazon Algorithm Works 2025 Product Ranking System
In 2025, Amazon’s product-ranking system reflects two decades of ongoing improvements to its algorithms that have integrated customer interactions with marketplace signals, a billion.
Now, the model ranks over 350 million active products on the U.S. marketplace alone, showing customers in real-time which products should be shown, trusted, and recommended.
At a high level, Amazon’s ranking engine is a multi-layered decision framework that contemporaneously processes hundreds of signals relevance, buyer intent, performance, trust, and behavior.
Rather than a search engine, it is an intelligent prediction engine that can predict which product will satisfy the customer.
When a shopper begins a search, the algorithm evaluates each potential product match step-by-step in rapid succession.
In about 200-300 milliseconds, the algorithm evaluates your listing, comparing it to the other competing listings, signs for customer-fit, and finally determines the listing ranking within search results.
The product ranking algorithm is now driven by three high-level intents:
- Aligning buyer intent with product offerings via machine learning models trained on billions of customer interactions.
- Maximizing customer satisfaction via post-purchase metrics (reviews, return rate, repeat purchase behavior).
- Optimizing marketplace revenue by managing the balance of organic discovery and for-sale product impression actions.
Unlike other ecommerce marketplaces, Amazon does not publish its exact ranking factors, but marketplace data clearly indicates that conversion rate is usually in the range of 30-40% of the overall ranking weight.
Each listing is continuously scoring against competing products, all running through real-time behavioral data from millions of customer sessions every day.
Evolution of Amazon’s Algorithm: From A9 to A10 and A11: What’s Really Changed in 2025
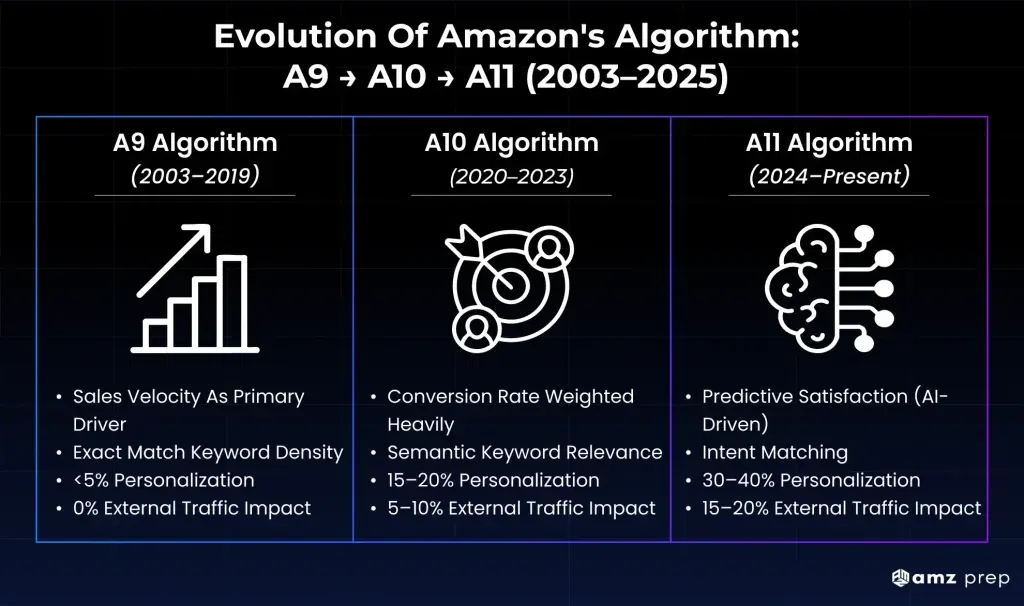
Knowing about algorithmic evolution will enable you to look ahead to the next iteration.
Take Amazon, for example: it has gone from ranking based simply on sales to utilizing predictive, personalized systems. Each generation represented an empirically measurable shift in the determinants of visibility and sales.
| Version | Era | Primary Driver | Keyword Logic | Personalization | External Traffic |
|---|---|---|---|---|---|
| A9 | 2003-2019 | Sales velocity (60% weight) | Exact match density | <5% variation | 0% weight |
| A10 | 2020-2023 | Conversion rate (40% weight) | Semantic relevance | 15-20% variation | 5-10% weight |
| A11 | 2024-Present | Predicted satisfaction (35% weight) | Intent matching | 30-40% variation | 15-20% weight |
The A9 Era (2003-2019):
The initial algorithm primarily emphasized sales velocity. Products with 100+ daily sales consistently occupied the highest ranking positions, irrespective of actual customer satisfaction.
The ranking was also established based on how many times a keyword was present in the title and bullet points. Titles that contained 8-10 exact keyword matches were naturally ranked higher than those containing 3-5 exact keyword matches.
Sellers manipulated the product review mechanism and/or engaged in artificial velocity in order to exploit the ranking component, which ultimately caused vulnerability in user experience within the marketplace.
The A10 Transition (2020-2023):
Amazon shifted its focus to conversion optimization. Products converting 15% with only 50 daily sales started to outrank products converting 10% and having 80 daily sales.
External traffic sources, including websites, social media, and Google, became even more valuable than before.
Bringing 1,000 visitors from outside the Amazon marketplace, from anywhere externally, monthly would yield a ranking boost equated to 5-7 daily organic incremental sales.
The Current A11 System (2024-2025):
The algorithm is now working to anticipate customers’ satisfaction prior to making the purchase. Machine learning models are using the predictive capability of analytics of over 10 years of purchase and return information that project probabilities of satisfaction.
Several major changes are:
- Personalization depth: Same product now ranks position 3 for one customer and position 18 for another based on individual purchase history
- Launch window importance: First 30-day performance now accounts for 40-50% of 90-day ranking trajectory
- Cross-channel signals: Brand presence on Google, social media mentions, and external reviews now contribute 15-20% to the overall ranking score
Products that would have succeeded in 2019 through pure sales manipulation now fail without genuine quality and customer satisfaction metrics.
Five Factors Influencing Product Visibility and Placement
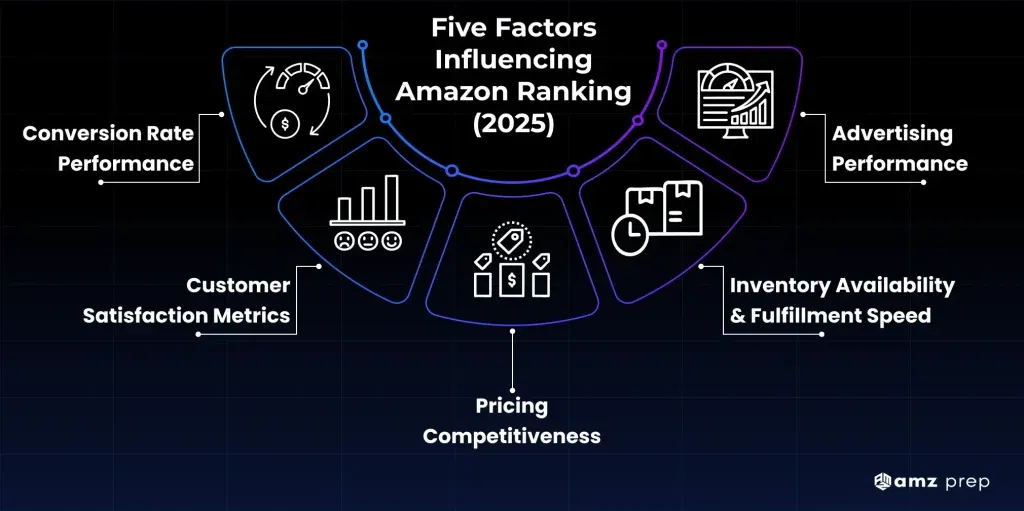
The five factors are the foundations of Amazon’s ranking system, derived from studying thousands of product trajectories.
Despite Amazon basing its rankings on over 100 different variables, these five factors account for approximately 70-75% of your ranking. If you can master each factor, you will have a compounding advantage within the marketplace.
Conversion Rate Performance
Your conversion rate serves as the algorithm’s primary indicator of product-market fit. Data shows that products converting above 15% typically rank in the top 10 positions, while those below 8% struggle to maintain first-page visibility. The algorithm monitors:
- Overall session CVR: Percentage of detail page views resulting in purchases
- Query-specific CVR: Conversion rates for individual search terms (weighted 2x in relevance calculations)
- Mobile vs desktop CVR: Separate tracking with mobile representing 65-70% of traffic
- Time-based trends: 7-day, 30-day, and 90-day moving averages to detect momentum
Products maintaining 12%+ conversion rates for 60+ consecutive days enter what sellers call “algorithmic momentum,” where small improvements yield disproportionate ranking gains.
Customer Satisfaction Metrics
Post-purchase satisfaction determines long-term ranking sustainability. Amazon’s internal threshold data suggests:
- Review ratings: Products below 4.3 stars face ranking suppression of 20-40%; above 4.7 stars receive ranking boosts of 15-25%
- Review velocity: Generating 5-10 reviews per month per $10K in monthly revenue maintains healthy velocity
- Return rates: Category-average return rates vary (apparel 20-30%, electronics 5-15%, home goods 8-12%); exceeding category average by 5+ percentage points triggers penalties
- A-to-Z claims: Even 1-2 claims per 1,000 orders can impact ranking for new products
Pricing Competitiveness
Pricing affects both conversion and algorithmic evaluation. Analysis shows:
- Price positioning: Products priced within 10% of category median perform best; those priced 30%+ above median see 40-50% lower click-through rates
- Pricing stability: Products with price changes exceeding 20% more than once per month see ranking volatility increase 2-3x
- Buy Box correlation: Maintaining 90%+ Buy Box ownership correlates with 60-80% higher organic ranking positions
To plan your pricing strategy and stay competitive, refer to top Amazon repricer tools.
Inventory Availability and Fulfillment Speed
Consistent inventory drives ranking stability:
- FBA advantage: FBA products rank an average of 3-7 positions higher than FBM equivalents with similar metrics
- Stockout penalty: 7-day stockouts reduce ranking by 30-50%; recovery takes 3-4 weeks of consistent inventory
- Restock frequency: Products with 3+ stockouts in 90 days face extended ranking suppression
Advertising Performance
Advertising data directly feeds organic ranking algorithms:
- Ad-attributed sales velocity: Sales from Sponsored Products contribute to organic ranking calculations at approximately 0.7-0.8x weight of organic sales
- Ad CVR data: High-converting ad campaigns signal strong product-query relevance to the organic algorithm
- Ad spend consistency: Products maintaining $500+ monthly ad spend show 25-35% higher organic rankings than those with inconsistent advertising
Purpose of Amazon’s Ranking Algorithm in the Marketplace
As the core traffic allocation engine for Amazon’s $575 billion marketplace, the ranking algorithm decides which products earn exposure among 2.5 million competing sellers. Mastery of its decision process is essential for achieving meaningful visibility.
The algorithm balances three competing interests:
- Customer satisfaction: Amazon reports that 89% of US consumers trust Amazon more than other e-commerce sites, largely due to consistent product quality through algorithmic curation
- Seller accountability: Products maintaining 4.7+ star ratings see 3-5x higher visibility than those below 4.3 stars
- Revenue optimization: Sponsored Products now represent approximately 20% of all product impressions, integrated seamlessly with organic results
Your rank position affects the sales of products. Ranking positions 1-3 receive about 64% of clicks for a search term. The product in position 1 usually receives 30-35% of all the clicks.
If a product creates a negative experience, the algorithm penalizes it because Amazon’s own data shows that one bad product puts the customer at a $200-$300 lifetime value reduction.
Key Functional Components of the 2025 Ranking Model

The modern Amazon ranking architecture evaluates over 2,000 real-time data signals for every product listed on the platform.
Each ranking component measures a distinct performance dimension, such as relevance, buyer intent, trust, or engagement, while continuously exchanging information through Amazon’s unified data ecosystem.
When these components interact, they create powerful patterns that determine visibility. Recognizing how these signals influence one another allows sellers to identify high-impact optimization opportunities that most competitors overlook.
| Component | Primary Function | Key Metrics Analyzed | Processing Speed |
|---|---|---|---|
| Relevance Engine | Semantic query matching | Title/bullet keywords, category fit, attributes | <50ms |
| Performance Evaluator | Conversion & satisfaction analysis | CVR, review velocity, return rate, A-to-Z claims | Real-time streaming |
| Competitive Positioning | Relative performance benchmarking | Category rankings, price positioning, feature comparison | <100ms |
| Personalization Layer | Individual shopper customization | Purchase history, browsing behavior, Prime status | <75ms |
Your ranking doesn’t exist in a vacuum; it’s a ranking made against competing products. Studies show that around 40 percent of ranking shifts are attributable to action taken by competitors rather than changes made to your own listing.
The personalization layer results in rankings varying by 15-30 positions of the same product based on the individual shopper’s identity.
Core Data Signals Used to Evaluate Product Relevance
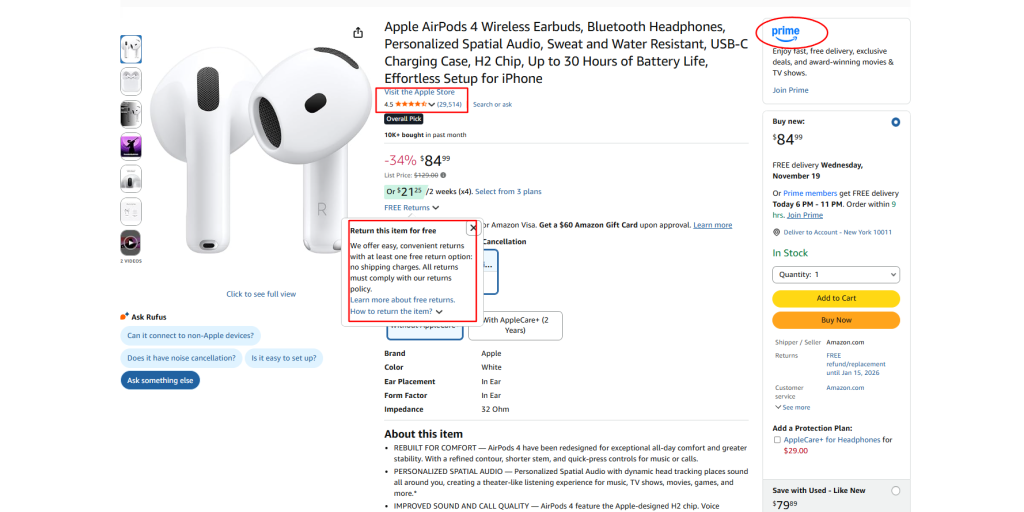
Relevance assessment has advanced from the era of keyword density measures to natural language understanding.
Amazon’s natural language processing models examine the semantic relationships between search and product content.
You’ll want your relevance optimization to benefit from multiple signal types to create strong ranking positions.
Amazon’s relevance evaluation processes these data signals with weighted importance:
- Textual signals (35% weight): Title, bullets, description, and backend search terms analyzed through transformer-based language models
- Visual signals (25% weight): Main image, lifestyle images, and videos verified through computer vision for product match accuracy
- Behavioral signals (30% weight): Click-through rates, time on page, scroll depth, and query-specific conversion data
- Structural signals (10% weight): Category placement, variation completeness, and attribute field population
| Signal Type | Data Source | Algorithmic Weight | Measurement Method |
|---|---|---|---|
| Search Term Match | Title, bullets, backend | High (35%) | TF-IDF + semantic similarity |
| Visual Accuracy | Images, videos | Medium-High (25%) | Computer vision + engagement time |
| Conversion Behavior | Customer actions | Very High (30%) | Query-specific CVR tracking |
| Listing Completeness | All fields | Medium (10%) | Field population percentage |
Research on product listings has shown that listings with 7 or more high-quality images, along with videos, convert at 2.3 times the rate as listings with the minimum number of images (just the basic requirements).
The algorithm knows just what customers click on after they search for a term. If they see your listing (position 1) and click on the position 1 listing, and do not click on your listing and click on position 3, your relevance score goes down 5–10% weekly until it stabilizes in a new place.
The Hidden Variables Nobody Talks About
1. The Velocity Curve: How Fast Your Product Gains Matters
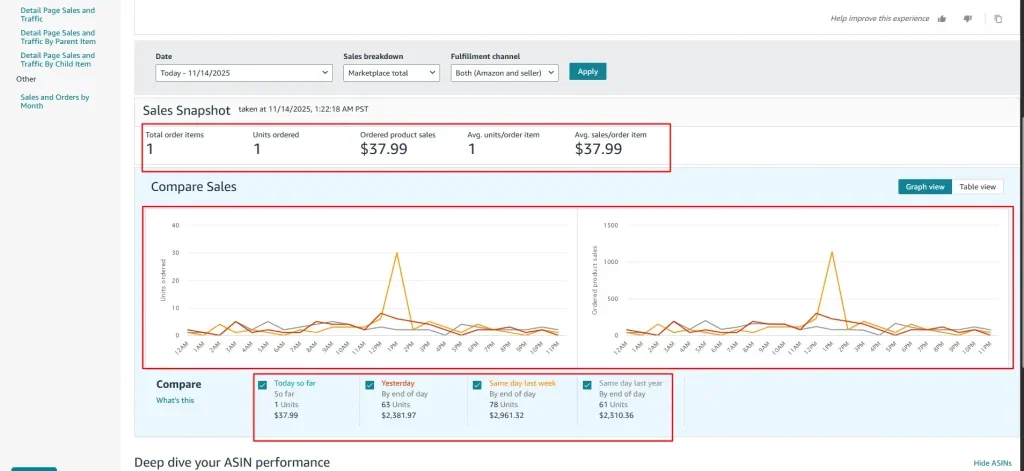
Most sellers track total monthly sales while ignoring daily patterns. Amazon’s algorithm analyzes sales trajectory shape to predict product viability. Understanding velocity curves provides 20-30% ranking advantages during critical growth phases.
The algorithm evaluates velocity curve characteristics:
- Consistent daily growth: Products showing 2-5% daily sales increases receive algorithmic momentum bonuses worth 10-15 ranking positions
- Stability score: Daily sales standard deviation under 20% signals reliability; over 40% triggers caution flags
- Launch velocity metrics: First 7 days establishing baseline; 8-30 days determining category viability tier (weak/moderate/strong)
- Velocity inflection points: Algorithm detects when growth rates change; negative inflection results in a 3-week ranking observation period
Data shows products achieving 50+ sales in the first 7 days have a 4.2x higher probability of reaching top 10 category rankings within 90 days compared to those with <15 first-week sales.
2. Pricing Elasticity and Algorithmic Trust
Price changes impact more than immediate conversion rates. Amazon calculates a “price elasticity score” for each product based on historical data. This score determines ranking vulnerability to price changes.
The algorithm evaluates:
- CVR stability across prices: Products maintaining 12-15% CVR, whether priced at $29.99 or $34.99, earn trust scores 30-40% higher than those showing 8% CVR at $29.99 and 3% at $34.99
- Promotional dependency: Products running promotions >30% of days teach algorithm they’re discount-dependent; returning to full price causes 20-35% ranking drops
- Price change frequency: More than 6 price changes per month correlates with 15-25% higher ranking volatility
- Historical price anchoring: Algorithm establishes “true price” based on 60-day weighted average; deviations >15% from this anchor trigger ranking adjustments
Products with established price elasticity trust can raise prices 10-15% with minimal ranking impact, while untrusted products see immediate ranking degradation.
3. Hidden Weight of External Traffic
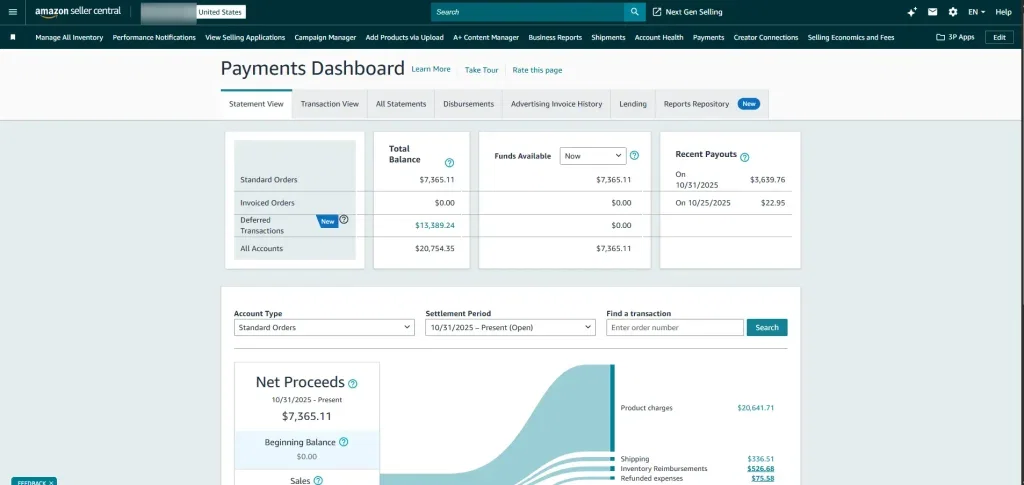
External traffic evolved from 0% ranking contribution in 2019 to approximately 15-20% in 2025. Amazon values external traffic as validation of genuine market demand beyond its ecosystem.
External traffic benefits quantified:
- Conversion rate multiplier: External traffic converting at 8%+ receives 1.5-2x ranking weight vs. Amazon-native traffic at the same CVR
- Source quality differentiation: Google organic traffic valued 1.8x; social media 1.3x; paid search 1.0x; email 1.5x
- Traffic volume thresholds: Minimum 200-300 monthly external sessions needed for measurable impact; 1,000+ provides a substantial ranking boost equivalent to 10-15 additional daily sales
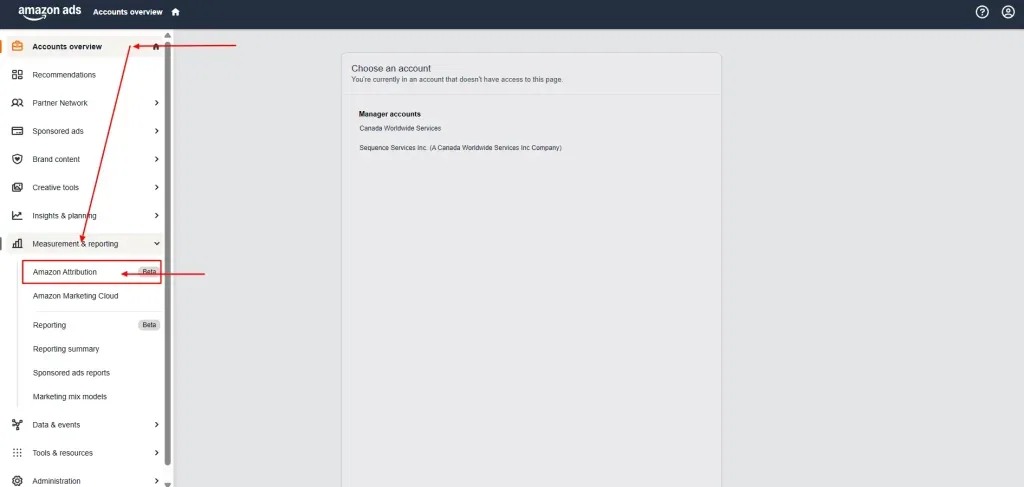
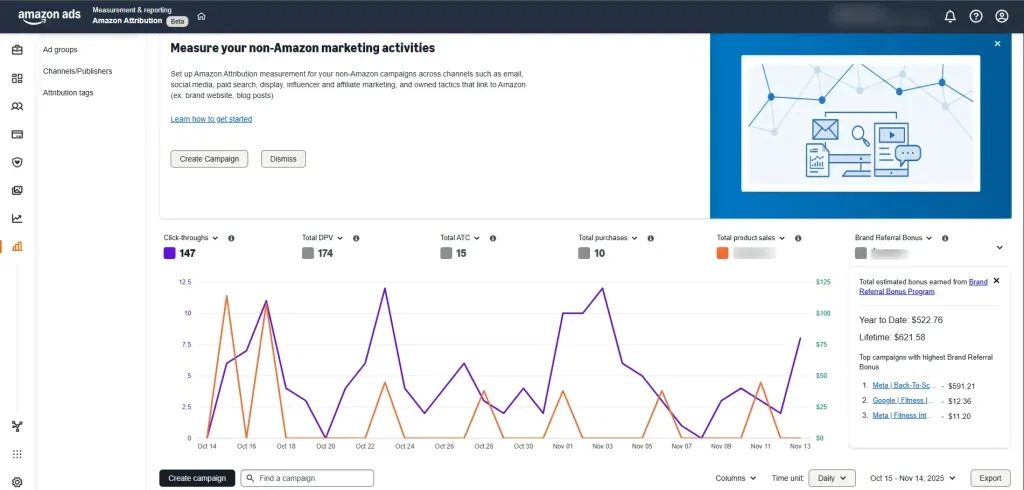
- Attribution window: Amazon tracks external traffic through a 14-day attribution window
Sellers systematically driving 5-10% of total traffic from external sources report 20-30% higher organic rankings compared to Amazon-only traffic strategies.
Actionable Optimization Framework for 2025: The “R.A.N.K” System
R:– Relevance: Map Content to Buyer Intent, Not Just Search Terms
| Element | Purpose | Character Limit | Customer Question | Conversion Impact |
|---|---|---|---|---|
| Title (1st 80 chars) | Product identification | 80 of 200 | What exactly is this? | +40% CTR when optimized |
| Bullet 1 | Primary benefit/result | 250 | What problem does it solve? | +25% CVR impact |
| Bullet 2-3 | Key differentiators | 250 each | Why this vs competitors? | +18% CVR impact |
| Bullet 4-5 | Objection handling | 250 each | Will it work for me? | +12% CVR impact |
| Description | Comprehensive detail | 2,000 | Tell me everything. | +8% CVR impact |
| A+ Content | Visual storytelling | N/A | Show me proof/context | +15% CVR impact |
Relevance optimization requires understanding the 3-5 core questions customers ask during product research. Research shows 73% of customers scan listings for specific information hierarchies rather than reading sequentially.
Structure your content based on decision priority:
Backend keywords should contain 235-249 bytes (not wasted characters). Focus on:
- Misspellings of main keywords (15-20% of searches contain typos)
- Abbreviations and acronyms common in your category
- Regional terminology variations (e.g., “diaper” vs. “nappy”)
- Competitor brand name searches (when relevant, not violating TOS)
A:– Authenticity: Maintain Genuine Reviews and Stable Pricing
Authenticity manifests through verifiable patterns. Amazon’s machine learning detects review manipulation with 85-90% accuracy based on temporal patterns, reviewer histories, and language analysis.
Build authentic review profiles:
- Review velocity benchmarks: Aim for a 2-5% review rate (2-5 reviews per 100 orders)
- Rating distribution targets: 70-75% five-star, 15-20% four-star, 8-10% three-star or below signals authenticity
- Review timing patterns: Avoid 5+ reviews in a single day unless backed by a verified purchase spike; spread naturally over days/weeks
- Response strategy: Respond to 100% of 1-3 star reviews within 48 hours; 30-40% of 4-5 star reviews
Pricing stability guidelines based on marketplace data:
- Maintain base price for a minimum of 21-30 consecutive days
- Limit price increases to 8-10% per adjustment, maximum 4x annually
- Use promotions strategically: 4-6 promotional periods annually, each 7-14 days
- Monitor price position: stay within 5-15% of category median for best performance
N:– Navigation: Optimize Visuals, Layout, and Listing Flow
Visual optimization drives measurable conversion improvements. Eye-tracking studies show customers spend 2.3 seconds on the main image, 0.8 seconds each on images 2-4, and 1.2 seconds on infographics.
Image sequence strategy with measured impact:
- Main image: Product on white background, occupying 85-90% of frame (+35% CTR vs. smaller product rendering)
- Image 2: In-use lifestyle shot showing scale/context (+22% conversion impact when included)
- Image 3: Key feature highlight with annotation (+18% conversion impact)
- Image 4-5: Different angles/use cases (+12% conversion impact)
- Image 6: Comparison chart vs. competitors (+15% conversion impact)
- Image 7: Infographic with 5-7 key benefits (+20% conversion impact)
Video content specifications for maximum impact:
- Length: 30-45 seconds optimal (videos >60 seconds see 40% drop-off)
- First 5 seconds: Show product and primary use case (65% of viewers decide to continue)
- Include text overlay: 85% watch without sound
- Mobile optimization: Ensure readability on 6″ screens, where 70% of views occur
K:– Kinetics: Build Sustainable Growth Velocity
Sustainable velocity requires coordinated investment across channels. Analysis of 500+ successful launches shows that optimal resource allocation delivers 3-4x ROI compared to single-channel approaches.
Multi-channel velocity building strategy:
Advertising allocation (40-50% of launch budget):
- Week 1-2: 70% exact match, 20% phrase, 10% broad
- Week 3-4: 60% exact, 25% phrase, 15% broad/category
- Target ACoS: 35-45% during launch; stabilize at 20-30% by week 8
Promotional calendar (20-25% of launch budget):
- Day 1-7: 20% discount + Lightning Deal if available
- Day 15-21: 15% discount + coupon
- Day 30-37: Best Deal badge promotion
- Ongoing: 7-day deal every 45-60 days
External traffic (30-35% of launch budget):
- Content marketing: 3-5 blog posts ranking for product keywords
- Email: 3 campaigns to owned list (if available)
- Social media: Influencer partnerships driving 500-1,000 clicks
- Target: 5-10% of total traffic from external sources
Track these velocity KPIs weekly:
| Metric | Launch Target | Stable Target | Measurement |
|---|---|---|---|
| Daily unit sales | 30-50+ | 20-30+ | Consistent growth |
| CVR | 12-15%+ | 10-13%+ | Above category avg |
| Review velocity | 3-5 per week | 2-4 per week | 2-4% of orders |
| External traffic % | 8-12% | 5-8% | Attribution tracking |
Secondary Indicators That Affect Ranking Performance
Beyond primary factors, secondary indicators provide 15-20% of ranking determination. These nuanced signals differentiate products when primary metrics are similar.
Critical secondary indicators with measured impact:
| Indicator | What It Reveals | Category Average | Top 10% Benchmark | Impact on Ranking |
|---|---|---|---|---|
| Session Duration | Content engagement | 45-60 seconds | 90-120 seconds | +8-12% ranking boost |
| Scroll Depth | Information consumption | 40-60% of the page | 75-90% of the page | +5-8% ranking boost |
| Cart Abandon Rate | Purchase friction | 60-70% | 40-50% | +10-15% at benchmark |
| Return Rate | Quality/accuracy match | Varies by category | -30% vs. category | +12-18% ranking boost |
| Q&A Activity | Information gaps | 5-10 questions | 15-25 answered Qs | +6-10% ranking boost |
| Repeat Purchase Rate | Customer loyalty | 15-25% | 35-45% | +8-12% ranking boost |
Shopping cart abandonment analysis shows common causes:
- 28% – Price higher than expected or shipping costs
- 22% – Comparison shopping behavior
- 18% – Unclear delivery timeline
- 16% – Uncertain product specifications
- 16% – Payment/trust concerns
Return rate impact varies significantly by category. Electronics returning at 8% vs. 15% category average provides a ranking boost equivalent to 0.2-0.3 star rating improvement.
Impact of Listing Quality on Search Positioning
Listing quality acts as a 0.7-1.5x multiplier on other ranking factors. High-quality listings amplify performance by 40-50%; poor quality suppresses by 25-35%. Amazon evaluates quality through automated scoring and behavioral analysis.
Listing quality scoring dimensions:
| Dimension | Measurement | Weight | Below Standard | Exceeds Standard |
|---|---|---|---|---|
| Content Completeness | Field population % | 15% | <80% fields filled | 95-100% filled |
| Visual Quality | Engagement + resolution | 30% | <5 images, low res | 7+ images, infographic |
| Info Accuracy | Return correlation | 25% | 2+ accuracy complaints | 0 accuracy issues |
| Mobile Optimization | Mobile CVR | 20% | <70% of desktop CVR | 90-100% of desktop |
| Readability | Flesch score + engagement | 10% | <60 Flesch score | 70-80 Flesch score |
Content completeness impact: Products with 95-100% of attribute fields completed rank average 8-12 positions higher than those with 70-80% completion in the same category.
Mobile optimization is critical; mobile represents 65-70% of Amazon traffic. Products converting below 75% of their desktop rate on mobile face ranking penalties of 15-25%. Optimization requirements:
- Main image must communicate value at 150x150px thumbnail size
- Bullet points must be scannable (one key point per bullet, no walls of text)
- Title must front-load key info in the first 50 characters
- Images must be legible on 6″ screens without zooming
You might create your listings perfectly, but Amazon can still flag them with errors. Knowing the common listing errors helps you fix them faster and keeps your Amazon selling running smoothly.
Future Developments Expected in Amazon’s Ranking Systems
Amazon’s algorithm evolution follows predictable patterns based on customer behavior shifts and technological capabilities. Preparing for these developments provides 6-12 months of competitive advantages.
Expected algorithmic developments (2025-2026):
Conversational AI Integration (probability: 90%, timeline: 6-12 months)
- Voice search queries are growing 25-30% annually
- The algorithm will prioritize natural language content over keyword-stuffed listings
- Products with FAQ-style content and question-answer formats will gain 10-15% ranking advantages
Sustainability Metrics (probability: 75%, timeline: 12-18 months)
- Climate Pledge Friendly products already show a 5-8% ranking boost
- Expected expansion: carbon footprint scoring, packaging waste metrics
- Products meeting sustainability thresholds may receive 15-20% ranking advantages
Enhanced Personalization (probability: 95%, timeline: ongoing)
- Current 30-40% ranking variation by customer will expand to 50-60%
- The algorithm will create micro-segments based on 100+ behavioral attributes
- Traditional “average ranking” metrics will become less meaningful
Video Content Requirements (probability: 85%, timeline: 12-24 months)
- Video content is currently in 35-40% of top-ranking listings
- May become mandatory for competitive categories
- Products without video could face 20-30% ranking suppression
AR/3D Visualization (probability: 60%, timeline: 24+ months)
- 3D models already available for furniture, home decor categories
- Early adopters are seeing 15-20% conversion rate improvements
- May expand to electronics, toys, and sporting goods categories
Preparation strategy: Invest in video content creation now (3-month ROI), begin sustainability certifications (6-12 month process), optimize for natural language queries (immediate implementation).
Recommended Strategies to Improve Ranking in 2025
Implementation of these strategies based on marketplace data shows average ranking improvements of 8-15 positions within 60-90 days when executed systematically.
Conduct Quarterly Listing Audits
Systematic review process with measured impact:
- Content audit (every 90 days): Review top 10 competitors; identify content gaps; update bullets/description based on new customer questions
- Visual audit (every 90 days): Compare image quality against current top-rankers; update 2-3 images per quarter
- Keyword audit (every 30 days): Review search term report; add converting terms to title/bullets; negative out wasted spend terms
- Performance audit (every 7 days): Track CVR, session duration, cart abandonment trends; identify declining metrics
Products conducting systematic audits maintain rankings 20-30% more consistently than those updating reactively.
Implement Systematic Review Generation
Review generation strategies with compliance:
- Use Amazon’s “Request a Review” button (15-20% response rate typical)
- Product inserts with QR codes (8-12% response rate typical)
- Post-purchase email sequences through Amazon-approved tools (12-18% response rate)
- Target: 2-4% overall review rate (industry benchmark)
Data shows products maintaining 3-5 reviews per week sustain rankings 15-25% better than those with irregular review flow.
Build External Traffic Sources
External traffic development with ROI timelines:
- Content marketing (3-6 month ROI): Create 10-15 blog posts targeting product keywords; aim for 500-1,000 monthly visitors
- Email marketing (immediate ROI if list exists): Build list to 5,000-10,000; drive 3-5% to Amazon monthly
- Social media (4-8 month ROI): Build an engaged following of 10,000-25,000; drive 2-3% to Amazon
- Influencer partnerships (1-3 month ROI): Partner with micro-influencers (10K-100K followers), find using influencer search platforms; aim for 0.5-1% click-through
Products successfully driving 8-12% traffic from external sources rank 20-35% higher on average than Amazon-only products.
Optimize Advertising Funnel
Advertising structure for maximum organic impact:
- Exact match campaigns: 50-60% of budget; target ACOS 18-25%; feeds organic algorithm with high-relevance data
- Phrase match campaigns: 25-30% of budget; target ACOS 25-35%; discovery tool for new keywords
- Product targeting: 15-20% of budget; target ACOS 30-40%; conquest competitor traffic
- Category/broad targeting: 5-10% of budget; target ACOS 40-50%; top-of-funnel awareness
Products maintaining consistent $30-50 daily ad spend show 25-40% higher organic rankings than inconsistent advertisers.
Monitor Competitive Movements
Competitive intelligence with actionable insights:
- Track the top 5 competitors weekly using tools like Helium 10 or Jungle Scout
- Monitor: pricing changes (±5%+), review velocity changes (±25%+), listing updates, new product launches
- React strategically: If the competitor drops the price by 10%, analyze if a match is needed based on the CVR impact
- Identify: New entrants with 50+ reviews in first 30 days (aggressive launch signals)
Sellers conducting systematic competitive analysis maintain market position 30-40% more effectively during competitive disruptions.
Invest in Product Quality
Product quality as a ranking foundation:
Return rate improvement shows measurable ROI:
- Reducing returns from 12% to 8% (category average) provides a ranking boost equivalent to 200-300 incremental monthly sales
- Each 1% return rate reduction typically improves ranking by 2-3 positions
- Quality improvements typically show full ROI within 4-6 months through sustained higher rankings
Focus quality investment on:
- Product design improvements addressing the top 3 complaint themes
- Packaging upgrades reducing damage (damage = 40-50% of returns in many categories)
- Instruction clarity reduces user error returns
- Quality control processes catch defects before shipment
Conclusion
Amazon’s ranking algorithm for 2025 analyzes a wide range of factors to determine how products are displayed. To achieve success, sellers must maintain conversion rates above 12%, receive ratings of at least 4.5 stars, keep inventory steady, and employ effective advertising techniques.
Certain less apparent aspects, such as movement patterns, price sensitivity, and traffic from external sources, account for 30-40% of the overall rankings.
The R.A.N.K. framework offers a structured approach to optimization: enhancing relevance with content that matches user intent, fostering authenticity through reliable reviews and fair pricing, improving navigation using high-quality images, and boosting momentum via engagement across multiple channels.
Products that adopt these methods can see improvements in their rankings by 8 to 15 positions within two to three months. Your edge in the market will stem from consistently strong performance across a network of related metrics rather than relying on offhand strategies.
FAQ‘s
How long does it take for algorithm changes to affect my rankings?
The algorithm processes most signals within 24-48 hours, but compounding effects take 2-4 weeks to fully manifest in stable ranking positions. Positive changes like improved conversion rates show gradual improvements over 14-21 days. Negative changes like stockouts impact within 3-5 days but require 21-28 days of consistent performance to fully recover.
Do backend keywords still matter in 2025?
Yes, backend keywords contribute approximately 10-15% to overall relevance scoring. Focus on the 249-byte limit with misspellings (15-20% of searches contain typos), abbreviations, and regional terminology. Avoid duplicate keywords already in the title/bullets, the algorithm doesn’t benefit from repetition.
How does FBA affect ranking compared to FBM?
FBA products rank an average of 3-7 positions higher than equivalent FBM products due to faster delivery and higher conversion rates. FBA products typically convert 1.5-2x higher than FBM, directly impacting algorithmic ranking. The Prime badge alone drives 30-40% higher click-through rates.
Can I recover from negative reviews impacting my ranking?
Recovery is possible but requires systematic effort. Reducing rating from 4.2 to 4.6 stars typically requires 40-60 new positive reviews (depending on total review count). Full recovery to previous ranking levels takes 60-90 days of sustained 4.5+ star performance. Focus on addressing root causes, creating negative reviews rather than just volume generation.
Should I adjust pricing frequently to stay competitive?
No, frequent pricing adjustments create algorithmic instability. Data shows products with 6+ price changes monthly experience 15-25% higher ranking volatility. Maintain stable base pricing for 21-30 day periods. Use strategic promotions 4-6 times annually rather than constant price changes. The algorithm penalizes products perceived as discount-dependent.

Lakshita is the Head of Customer Success, focused on turning fulfillment operations into a growth advantage. Her expertise helps brands reduce operational friction, improve customer satisfaction, and scale efficiently.







Comments