
The average small Amazon seller brings in about $11,700 a month in sales and keeps about $2,450 of it. That’s a 21% net margin, based on Jungle Scout’s seller survey. Across all US independent sellers, Amazon reports average annual sales above $375,000 in 2025.

Revenue isn’t profit. Seller Central shows you the first number. Your bank account shows the second.
At AMZ Prep, we prep more than 10 million units a month for 5,000+ brands. The fee and fulfillment math below comes from that work and Amazon’s 2026 rate card. The market figures come from Amazon, Jungle Scout, and Marketplace Pulse.
What Amazon Sellers Actually Make in 2026
Two numbers get mixed up constantly. Average sales is one. Take-home profit is the other, and it’s much smaller.
Amazon’s Q1 2026 earnings show third-party seller services hit $41.6 billion in quarterly revenue, up 14% year-over-year. That’s commission and fulfillment fees sellers paid to Amazon, not seller take-home profit.
| Metric | Figure | Source |
|---|---|---|
| Average annual sales, US independent sellers (2025) | $375,000+ | Amazon Small Business Empowerment Report |
| US independent sellers above $1M in sales (2025) | 75,000+ | Amazon |
| Average SMB monthly sales | $11,671 | Jungle Scout |
| Average SMB net margin | 21% | Jungle Scout |
| Average SMB monthly profit | $2,451 | Jungle Scout |
| Sellers with margins above 20% | 28% | Jungle Scout |
| Active sellers worldwide, end of 2025 | 1.65 million | Marketplace Pulse |
| Sellers above $100M a year | 235 | Marketplace Pulse |
Marketplace Pulse counts more than 100,000 million-dollar sellers worldwide. Amazon’s count of 75,000+ covers US independent sellers only. The scopes differ, so both figures can be right.
Revenue vs Profit on a $10,000 Month
Margin decides almost everything here. At the 21% survey average, a $10,000 month leaves about $2,100. Push margin to 25% and it’s $2,500. Drop to 12% and it’s $1,200.
The 2026 Marketplace Reality
Fewer sellers are competing now. Marketplace Pulse counts 1.65 million active sellers at the end of 2025, down from 2.4 million in 2021. Only 165,000 new sellers registered on Amazon.com in 2025. That’s a decade low and 44% below 2024.
The upside is that traffic per active seller is up 31% since 2021. Amazon disputes some of these counts and says they understate sellers. Even so, the direction is clear. The barrier to entry is higher, and sellers who stay get more of each shopper’s attention.
Amazon Sellers Income By Business Model
Your business model sets your startup cost and your profit ceiling. The ranges below are typical estimates, not survey figures. Category and execution move them a lot.
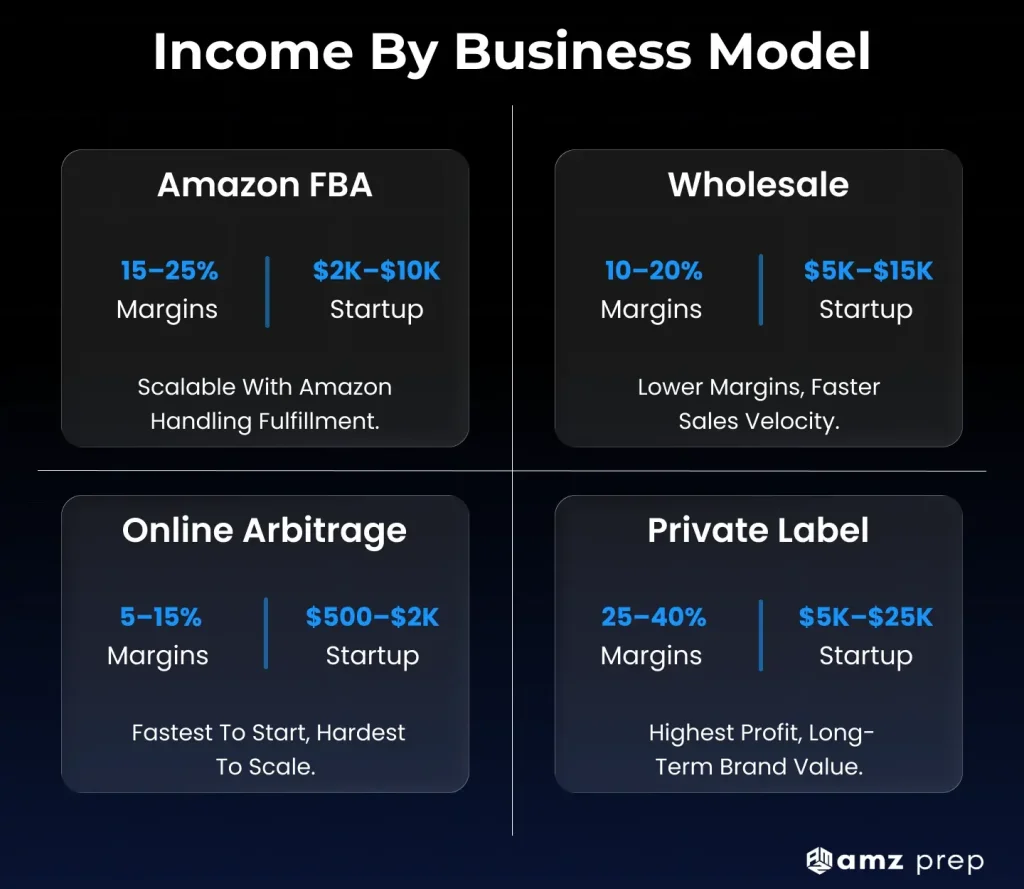
Amazon FBA (Fulfillment By Amazon)
- Typical margins: 15-25%
- Startup capital: $2,000-$10,000
- Time to profit: 6-12 months
FBA sellers source products and send inventory to Amazon. Amazon handles storage, picking, packing, shipping, and customer service. The Prime badge usually lifts conversion, and you scale without hiring warehouse staff.
Fees are the trade. 2026 brought a fulfillment fee increase in January, a fuel surcharge in April, and higher storage rates in July. Our look at the FBA adoption rate in 2026 shows how many sellers still choose this model.
Wholesale
- Typical margins: 10-20%
- Startup capital: $5,000-$15,000
- Time to profit: 3-6 months
Wholesale sellers buy known brands in bulk from manufacturers or distributors. Margins run thinner than private label. Products move faster, though, and marketing costs less because shoppers already know the brand. Selling wholesale on Amazon takes different skills, mostly supplier relationships and inventory commitments.
Online Arbitrage
- Margins: 5-15%
- Start-up cash: $500-$2,000
- First profit: 1-3 months
You’re buying discounted Ninja blenders from Walmart clearance and reselling them on Amazon. It’s fast. You can make your first $200 in a weekend if you know where to look.
The problem shows up around month four. You can’t find enough inventory to break $5,000/month consistently. Last month’s winning product is out of stock. This month’s opportunity disappears in 48 hours. You’re spending 15 hours a week hunting deals just to stand still.
No manufacturer relationships. No purchase orders. No predictability.
It works until it doesn’t scale.
Private Label
- Margins: 25-40%
- Start-up cash: $5,000-$25,000
- First profit: 6-18 months
You’re creating your own brand. You find a manufacturer, put your logo on a yoga mat or kitchen gadget, ship 500 to 1,000 units to Amazon, and hope people buy it.
The upside is real. You own the listing and control the pricing. Get past $1M in revenue and you’ve built something a buyer may pay a multiple of profit for.
The downside is also real. You’re fronting $10,000 to $15,000 before you know if anyone wants your product. Many first launches miss. The second usually goes better because you learned what not to do.
This isn’t a side hustle. It’s a 12 to 18 month bet that pays off if you survive the learning curve.
First-Year Income Expectations
Most sellers who reach profit get there inside a year. Jungle Scout’s survey found 58% were profitable within their first year:
- Under six months: 38% of sellers
- Six months to a year: 20% of sellers
For new sellers, Jungle Scout puts average profit at about $2,451 a month, or $29,412 a year. That’s an average. The spread is wide, and plenty of first-year sellers sit well below it.
How Much Starting Capital Matters
Capital buys time. A seller who can afford a full first order and a few months of ads can learn without stocking out. Undercapitalized launches often stall at the first reorder.
Category-Specific Profit Margins
These are typical net margin ranges by category. Treat them as a starting point, not a promise.
High-Margin Categories (25-40%)
Health & Personal Care: 28-35% average margin. Consumable products drive repeat purchases. Customers show less price sensitivity when buying health-related items, and subscription models work well here.
Beauty & Cosmetics: 25-40% average margin. Brand loyalty runs high in this category. The recurring purchase cycle makes customer acquisition costs easier to justify.
Home & Kitchen: 25-35% average margin in selective niches. Problem-solving products command premium pricing. Return rates stay lower than fashion or electronics, and demand holds steady year-round.
Medium-Margin Categories (15-25%)
Electronics Accessories: 15-25% margin. High velocity and year-round demand keep inventory moving. But the Buy Box competition puts constant pressure on pricing.
Toys & Games: 18-28% margin with Q4 seasonal spikes. Impulse purchases drive volume during the holidays. Just watch Q4 storage fees. They’ll eat your profit if you overstock.
Sports & Outdoors: 20-28% average margin. Seasonal demand cycles make inventory planning tricky, but niche subcategories offer differentiation opportunities.
Low-Margin Categories (5-15%)
Books & Media: 5% to 15%. Prices are low and competition is heavy. Media items also carry a closing fee on every sale.
Grocery & Gourmet: 8-15% average margin. Expiration dates create inventory risk. High return rates on damaged or spoiled items hurt profitability.
Office Products: 10-18% average margin. B2B bulk buying puts downward pressure on prices. Commodity products make differentiation tough.
The Real Cost of Amazon Fees in 2026
Amazon changed FBA fees three times in 2026.
- January 15: fulfillment fees moved into three price bands: under $10, $10 to $50, and over $50. Average increases were $0.05, $0.08, and $0.31 per unit, in that order. Items under $10 also get Low-Price FBA rates, about $0.86 per unit below standard.
- April 17: a 3.5% fuel and logistics surcharge landed on every FBA fulfillment fee in the US and Canada.
- July 1: standard-size storage rates went up.
| Change | Effective | Impact |
|---|---|---|
| Price-band fulfillment fees | Jan 15, 2026 | +$0.05 (under 10),+0.08 ($10 to 50),+0.31 (over $50) on average |
| Inbound placement fees | Jan 15, 2026 | Minimal-split fees up about $0.05 for standard-size items |
| Fuel and logistics surcharge | Apr 17, 2026 | +3.5% on every fulfillment fee |
| Standard-size storage | Jul 1, 2026 | $0.87/cu ft Jan to Sep (was $0.76), $2.40 Oct to Dec (was $2.10) |
| Aged-inventory surcharge | Jul 1, 2026 | Now starts at 180 days, at $1.50/cu ft per month |
What This Means for a $30 Product
Take a $30 item in large standard size, shipping at 12 ounces. It falls in the $10 to $50 band, where the 2026 fulfillment fee is $4.20. Add the 3.5% surcharge and it’s $4.35 per unit.
That’s a smaller jump than many sellers expect. The bigger 2026 costs hit elsewhere: storage, aged inventory, and placement fees on minimal splits. Our Amazon FBA calculator models all of these for your exact product.
| Fee type | 2026 rate | When it applies |
|---|---|---|
| Referral fee | 8% to 15% in most categories, higher in a few | Every sale |
| FBA fulfillment | From $3.32 (small standard, 2 oz, $10 to $50 band), rising with size and weight, plus 3.5% | Per unit shipped |
| Storage (Jan to Sep) | $0.87 per cubic foot | Monthly |
| Storage (Oct to Dec) | $2.40 per cubic foot | Monthly |
| Aged inventory | $1.50 per cubic foot from 180 days, up to $6.90 past 365 days | Monthly |
| Low-inventory fee | Varies by product, now checked per FNSKU | When stock covers fewer than 28 days |
| Inbound placement | Varies by size and weight, $0 with an optimized split | Per unit, minimal split |
How Fulfillment Costs Impact Take-Home Profit
FBA All-In Cost Per Unit
For the same $30, 12-ounce large standard item:
- Referral fee (15% category): $4.50
- FBA fulfillment, with surcharge: $4.35
- Monthly storage: about $0.15, depending on box size
- Inbound placement: $0 with an optimized split, about $0.20 to $0.40 with a minimal split
- Total Amazon fees: about $9.00 to $9.40
If the product costs $8 landed at FBA, all-in cost is $17.00 to $17.40. That leaves $12.60 to $13.00 in gross profit, a 42% to 43% gross margin before ads.
3PL Cost Comparison
Typical 3PL ranges, depending on volume:
- Pick, pack, and ship: $3.50 to $5.50 per unit
- Storage: $0.10 to $0.25 per unit monthly
- Inbound receiving: $0.15 to $0.35 per unit
- No inbound placement fees
- Total fulfillment cost: $4.00 to $6.00 per unit
For a light, standard-size item, FBA’s 2026 per-unit cost often lands close to a 3PL’s, sometimes lower. The math shifts with heavy or bulky goods, multichannel orders, and Q4 storage. That’s where 3PL fulfillment usually pulls ahead.
FBA makes sense for: newer sellers under 500 units a month, light standard-size products, listings that need the Prime badge, and brands without storage space.
3PL makes sense for: volume over 1,000 units a month, oversized or heavy products, multichannel selling, and avoiding Q4 storage rates. Brands that want more control while staying connected to Amazon can also look at Seller Flex.
Storage Fee Spikes
Standard-size storage runs $0.87 per cubic foot from January to September. From October to December it’s $2.40, about 176% higher.
A seller with 100 cubic feet in storage pays $87 a month most of the year. In Q4, that becomes $240 a month. Over-order for the holidays and unsold stock keeps costing you into the new year. Aged surcharges start at 180 days.
Revenue vs Profit vs Cash Flow
Gross Revenue
Total dollars customers pay. 100 units at $30 each = $3,000 gross revenue.
Gross Profit
Revenue minus COGS and Amazon fees.
- Revenue: $3,000
- Cost of goods: $800 (100 units at $8)
- Amazon fees: $920 (about $9.20 per unit)
- Gross profit: $1,280
Net Profit
Gross profit minus all operating expenses.
- Gross profit: $1,280
- Ad spend at 25% of revenue: $750
- Returns and refunds: $90
- Software: $80
- Net profit: $360 (12% net margin)
Ad spend is what pulls this seller below the 21% survey average. Bring ads down to 15% of revenue and net profit rises to $660, a 22% margin.
Cash Flow Reality
Plenty of sellers clear $10,000 a month in revenue and still run thin on cash. Inventory purchases eat everything that comes in, so they look profitable on paper but can’t fund the next reorder. Improving your Amazon profit margins through fee control and fulfillment choices is how most get out of that trap.
2026 Market Reality: Why Fewer Sellers Means More Opportunity
Amazon’s Q1 2026 results show third-party seller services revenue of $41.6 billion, up 14% year over year. That line is the fees sellers pay Amazon, not seller profit. Third-party sellers made up 60% of paid units, down from 62% in Q4 2024.
Marketplace Pulse calls 2025 “the Great Compression,” a year when several forces squeezed margins at once. Its numbers show who held on:
- Million-dollar sellers: more than 100,000 sellers now clear $1 million a year, up from about 60,000 in 2021.
- Hundred-million-dollar sellers: 235 sellers pass $100 million, up from 50.
- Top worries: in its 2026 Seller Index, nearly half of sellers named marketplace fees as their biggest margin worry. Another 46% pointed to advertising.
What this creates
- Organic traffic that actually converts because there are fewer sellers splitting the pie.
- Steadier Buy Box control. With three sellers instead of thirty, price wars cool down.
- A realistic shot at $1M+ annually without needing a miracle product.
Our Amazon seller statistics page tracks how this consolidation keeps moving.
What Top Amazon Sellers Do Differently
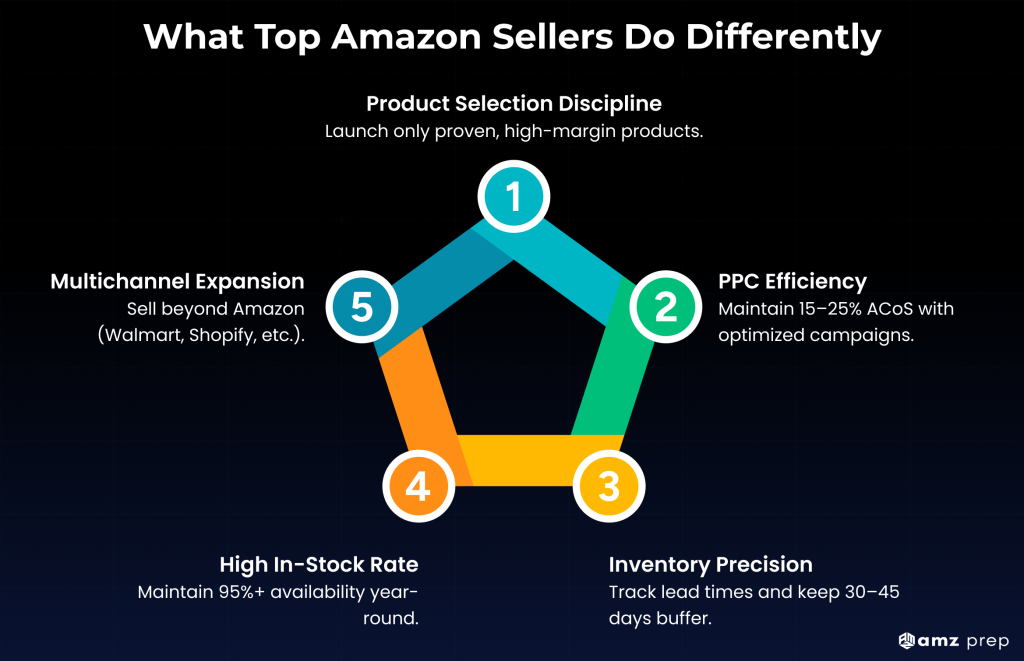
Product Selection Rigor
Top earners validate every assumption before ordering inventory. Search volume exceeds 1,000 monthly searches minimum. Competition shows under 100 reviews on top 5 listings. Margin potential clears 30%+ after all costs. Differentiation requires clear improvement over top ASINs.
They pass on most product ideas. Many use an Amazon BSR estimator to check demand before the first order.
PPC Efficiency
Many sellers let ad spend drift past 30% of revenue. The top earners we see usually keep it between 15% and 25%. They cut wasted keywords weekly and run exact match on proven terms. They trim broad match bids once data comes in and cover the funnel with Sponsored Brands and Display.
On $100,000 in annual revenue, the gap between 40% and 20% ad spend is $20,000 in profit. Our Amazon PPC guide covers the setup.
Inventory Planning That Actually Works
Most sellers order inventory when they’re two weeks from stockout. Then they panic-order and pay for air freight.
Seven-figure sellers track lead times down to the day. They know it takes 47 days from PO submission to FBA check-in, not “about six weeks.” They monitor daily sell-through rate, not monthly averages that hide spikes. They keep 30-45 days of safety stock for bestsellers so a warehouse delay doesn’t kill Q4.
They order Q4 inventory in June. Not September when everyone else is scrambling for container space.
The result is high in-stock rates, few emergency air shipments, and no aged-inventory surcharges from ordering out of fear.
Selling Beyond Amazon
Amazon-only brands can scale, but one channel means one point of failure. Most seven-figure sellers we work with run two or three.
They add Walmart.com. They launch a Shopify store for higher margins and their own email list. Many use Amazon’s Multi-Channel Fulfillment to ship off-Amazon orders from FBA stock. More than 300,000 sellers already do.
Diversified revenue also tends to make a brand more attractive to buyers when it’s time to sell.
Conclusion
Most small sellers keep about a fifth of what they sell. The gap between a thin month and a strong one usually comes down to fees, ad spend, and inventory timing. Before your next reorder, rerun your top three SKUs with 2026 fee rates.
Frequently Asked Questions
How much do beginner Amazon sellers make?
Jungle Scout’s survey puts new sellers at about $2,451 a month in profit, or $29,412 a year. That’s an average. Many first-year sellers earn far less, and 58% reach profitability within their first year.
What is a good profit margin for Amazon FBA?
The average small seller nets about 21% after all costs, per Jungle Scout. Anything above 20% is healthy, and 28% of sellers clear it. Below 10%, scaling gets hard because inventory eats your cash.
How long does it take to make money on Amazon?
Jungle Scout found 58% of sellers were profitable within their first year. About 38% got there in under six months. Another 20% took six months to a year. Capital and product choice drive the timing.
Can you make $10,000 a month selling on Amazon?
Yes, in revenue. The average small seller already does about $11,700 a month in sales, per Jungle Scout. At a 21% margin, $10,000 in monthly revenue leaves roughly $2,100 in profit.
Can I make $1,000 a month selling on Amazon?
Yes. At the 21% average net margin, $1,000 a month in profit takes about $4,800 in monthly revenue. That’s below the typical small seller’s sales of about $11,700 a month, per Jungle Scout.
How much does Amazon take from a $100 sale?
In a 15% referral category, Amazon keeps $15. A 100itemfallsintheover-50 fee band. Fulfillment for standard items up to 3 lb runs about $3.60 to $7, plus 3.5%. Total fees land near $19 to $22.
How much does it cost to start selling on Amazon?
The Professional selling plan costs $39.99 a month. The real cost is inventory, prep, freight to Amazon, and ads. Most private label launches need several thousand dollars before the first sale.
Do Amazon sellers pay for shipping?
Yes. FBA sellers pay a per-unit fulfillment fee covering pick, pack, and delivery. In 2026 it starts at $3.32 in the $10 to $50 band, plus 3.5%. FBM sellers pay carriers directly. pay carriers directly.
What is the difference between revenue and profit on Amazon?
Revenue is what customers pay you. Profit is what you keep after product costs, Amazon fees, ads, storage, and returns. At $10,000 in monthly revenue and a 21% margin, you keep about $2,100.

Arishekar N is a Vice President (VP) of Marketing at AMZ Prep, specializing in ecommerce fulfillment and Amazon logistics strategies with a proven track record of driving growth for e-commerce businesses. He is a strategic leader with extensive expertise in marketing, e-commerce operations, SEO & advertising, and branding.
Stay updated on his latest insights by following him
















Fewer sellers, but 31% more traffic each. Harder to start, but a bigger slice for the ones who stay.
That Q4 storage jump to $2.40 per cubic foot is the sneaky part. Overstocking looks smart in October and hurts in January.
Interesting that 30% off-Amazon revenue can raise the exit multiple. Diversifying isn’t only about risk.
Profitable on paper but can’t afford the next PO. That cash flow trap is more common than people admit.
$3,000 in revenue down to $110 net says it all. Most of that gap is ad spend, so ACoS matters more than unit cost.