
I’ve been in ecommerce for over a decade now. And I’ll be honest with you. I’ve never seen the Amazon marketplace change as dramatically as it did in 2025.
When I started at AMZ Prep, we were processing shipments for sellers who’d just launched their first product with a few thousand dollars. Today? We’re handling fulfillment for brands doing eight figures annually. The game has completely transformed.
Here’s the thing. Most “Amazon statistics” articles just throw numbers at you. That’s not what I’m going to do. I want to show you what these numbers actually mean for your business. And more importantly, what you should do about them.
Let’s dive in.
The Big Picture: Q4 2025 Was Massive
Amazon hit $187.1 billion in Q4 2025 sales. That’s an 11% jump from last year.
For the full year? $638.0 billion in total revenue.
But here’s what really matters to you as a seller. Third party sellers contributed $48.8 billion in Q4 alone. We now hold 61% of all paid units sold on Amazon.
Read that again. Independent sellers like you and me control more than half of everything sold on Amazon.
The numbers that should be on your radar:
- Total Amazon GMV crossed $750 billion (Marketplace Pulse estimates)
- Third party marketplace GMV hit $520 billion globally
- AWS revenue reached $105.4 billion annually, growing 17% in Q4
- Advertising generated $54.0 billion for the full year
- Operating margin hit 9.3% in 2025, up from 4.9% in 2024″
That last one is going to reshape how you think about product listings. More on that later.
Why Customers Keep Coming Back to Amazon
Before we get into the seller data, let’s talk about why any of this matters.
Amazon’s formula hasn’t changed. Product variety, competitive pricing, exclusive discounts, same day delivery, and Prime benefits. What has changed is how good they’ve gotten at executing it.
The platform handles customer acquisition and retention for you. That’s a massive head start compared to building your own DTC brand from scratch.
But this is important. It also means more competition. Every seller has access to the same 310+ million active customers.
The winners in 2026? They’ll be the ones who understand the data I’m about to share.
The Great Compression: What Happened to 750,000 Sellers?
This is probably the most important trend I’ve observed this year.
Amazon registered just 165,000 new sellers in 2025. That’s the lowest number in a decade. Down 44% from 2024.
At the same time, active sellers dropped from 2.4 million in 2021 to 1.65 million by end of 2025.
Where did everyone go?
Marketplace Pulse calls this “The Great Compression.” Multiple forces squeezed margins simultaneously. Tariffs, rising ad costs, increased fees, and competition from Chinese sellers who could undercut on price.
But here’s what most people miss. Fewer sellers actually means more opportunity per seller.
Traffic per active seller increased 31% since 2021. Over 100,000 sellers now generate $1 million+ annually. That’s up from 60,000 in 2021. And get this. 235 sellers now do $100 million or more, up from just 50 four years ago.
The bar for entry is higher than ever. But for those who clear it? The rewards have never been bigger.
Q1 2026: The Momentum Continues
Amazon started 2026 strong. Q1 revenue hit $143.3 billion, up 7% year over year.
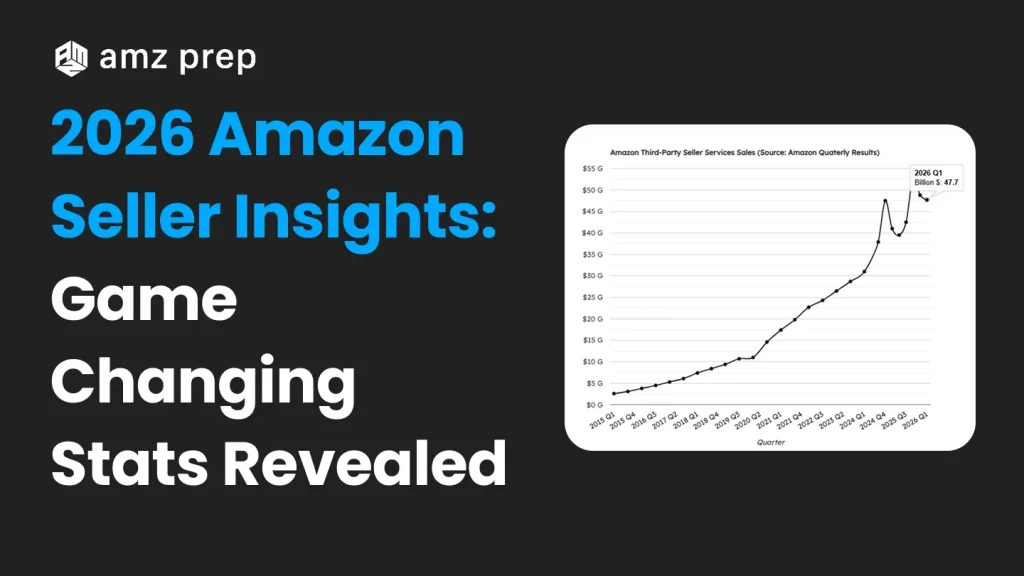
Third party seller services brought in $47.7 billion. That’s an 11% increase from Q1 2025.
AWS grew 17% to reach $27.5 billion. North America revenue climbed to $86.3 billion. International hit $29.5 billion.
Operating income jumped 55% to $15.3 billion in Q1 2026. Operating margin reached 10.7%.
What this tells me: Amazon is getting more efficient while still growing. That means more investment in infrastructure, faster shipping, and better seller tools. These Amazon Seller Updates show that operational improvements continue to create new opportunities for third party sellers.
The platform isn’t slowing down. And neither should you.
New Seller Registrations: The Decade Low
The pandemic surge brought 700,000+ new sellers in 2021. Everyone thought ecommerce was the future and wanted in.
By 2025? Just 165,000 new registrations.
What changed?
The composition shifted dramatically. Chinese sellers now represent 59.9% of new registrations. American sellers? Just 16.3%. That’s down from 70.8% in 2016.
Less than 8% of accounts registered before 2019 are still active today. Less than 30% of 2023 registrations are still selling.
This isn’t a marketplace for side hustles anymore. It’s infrastructure for serious operators.
Third Party Seller Share: We Run This Platform Now
In 2017, we crossed 50% for the first time. That was the moment third party sellers officially outsold Amazon’s own retail operations.
By Q4 2024 and Q3 2025, we hit an all time high of 62%.
The slight dip to 61% in Q4 2025? Normal seasonal variation. The trend hasn’t reversed.
Here’s what this means for you. Third party amazon sellers now represent 69% of total GMV, up from 60% in 2019. Amazon rewards performance over brand names. You don’t need to be Nike or Apple to win here. Experience matters, but it’s not a barrier.
Amazon Third Party Seller Services Revenue
Third party seller services generated $52.8 billion in Q4 2025. That’s an 11% year over year increase. Full year 2025 hit $184.1 billion.
Look at the trajectory from 2015 Q1 ($2.6B) to today. Revenue doubled from $11.0 billion in Q1 2020 to $22.7 billion by Q1 2022, then kept climbing.
The seasonal Q4 spikes reflect holiday shopping patterns. But each year sets new highs.
This is the money Amazon makes from us. Commissions, FBA fees, advertising. The fact that it keeps growing tells you the ecosystem is still expanding.
Amazon GMV: $830 Billion and Counting
Amazon and its sellers moved $830 billion in goods in 2025. That’s triple the 2018 number.
Here’s the critical insight. First party sales actually declined in 2025 ($255B vs $260B in 2024). Third party marketplace sales grew 15% ($575B vs $500B).
Amazon is becoming less of a retailer and more of a platform. Since 2019, the marketplace has driven 76% of incremental GMV. We now represent 69% of total GMV.
The shift from 1P to 3P continues at about 20 basis points annually. It’s slowing down, which suggests we’re approaching equilibrium. But the direction is clear.
North America Sales Growth
North America generated $127.1 billion in Q4 2025. Up 10% year over year. Full year 2025 reached $469.0 billion.
The growth trajectory accelerated dramatically during 2020 and 2021 and has maintained momentum. Q4 2025 was the highest quarterly figure in company history.
If you’re selling primarily in the US, the market is still expanding.
Amazon Advertising: $68.6 Billion Market
Q4 2025 advertising revenue hit $21.3 billion. That’s 22% year over year growth. Full year reached $68.6 billion.
This is now Amazon’s third largest revenue stream after retail and AWS.
Prime Video ads went live in 16 countries. Average ad supported audience: 315 million viewers globally.
What does this mean for sellers? Advertising is no longer optional. The successful sellers I work with allocate 30 to 40% of product revenue to Amazon advertising. Start at 20 to 25% for new products, then optimize based on ACoS.
The platform is pay to play now. Accept it and plan accordingly.
AWS Revenue: Why Sellers Should Care
AWS hit $35.6 billion in Q4 2025. That’s 24% growth, the fastest in 13 quarters. Full year: $128.7 billion.
Why should you care about cloud computing?
Because AWS funds everything else. AWS operating income reached $36.3 billion in 2025. That cash pays for fulfillment center expansion, seller tools, and logistics infrastructure.
Amazon’s capital expenditures reached $75.1 billion in 2025, with AWS continuing to drive infrastructure investment for faster delivery and better seller tools.
Strong AWS performance means Amazon has resources to invest in the marketplace. The tools you’re using? The faster delivery speeds? AWS profits are funding them.
FBA vs FBM: The 2025 and 2026 Reality
I get asked this question constantly. Should I use FBA or FBM?
Here’s the data:
- 78% of sellers prefer FBA for convenience and Prime eligibility
- 34% use FBM for cost control
- 22% use both strategically
FBA performance stats:
- FBA users are 5.2x more likely to earn $100,000 in their first year
- FBA sellers generate 6.3x more sales in their first year than non FBA users
- FBA shipping costs 70% less per unit than premium carriers
- FBA costs 30% less per unit than standard carrier shipping
Critical changes for 2026:
- Amazon eliminated FBA prep services effective March 2026
- AWD costs increased in January 2026
- FBA fees went up an average of $0.08 per unit
My recommendation? Use both strategically. FBA for Prime eligibility and same day delivery. The percentage of sellers using FBA shows why it remains a core fulfillment option, while a 3PL can handle prep, overflow storage, and multi channel fulfillment. The hybrid approach saves 15 to 40% on costs while maintaining competitive delivery speeds.
How Long Until You’re Profitable?
- 58% of sellers achieve profitability within 12 months. That’s the good news.
- The bad news? 22% never become profitable.
- According to SmartScout’s “Voice of the Amazon Seller 2025” report:
- Over 50% of sellers reported being less profitable in 2024
- 67% raised prices due to FBA fee hikes
- Nearly 60% who raised prices still reported lower profits
- 35% have experienced an account suspension
- Mid sized sellers ($100K to $1M) are most affected by suspensions
- The profit margin breakdown:
- 46% achieve margins of 11 to 25%
- 15% of SMB sellers reach 21 to 25%
- 12% earn very little (1 to 5%)
- 13% aren’t profitable
- Top 1% exceed 50% margins
The path to faster profitability? Focus on customer ratings, speedy delivery, and winning the buy box. Sellers who nail these can achieve positive ROI within 3 to 4 months.
Same Day Delivery Changed Everything
Same Day Only (2025 vs 2024): +70% increase
2025 was a turning point for fulfillment speed. Amazon delivered at its fastest speeds ever for the third consecutive year.
The numbers:
- 70% more items delivered same day in 2025 vs 2024
- Over 13 billion items arrived same or next day globally
- In the U.S., Prime members received 8+ billion items same or next day
- Groceries and everyday essentials made up half of same/next day deliveries
- 2,300+ cities and towns now have same day grocery delivery
- Rural same day customers nearly doubled
- Prime members saved 64 trips to physical stores (55+ hours saved)
- Average savings on delivery: $550 per U.S. Prime member
- Amazon Now ultra fast delivery (30 minutes) launched in India, Mexico, and UAE. Testing is underway in the U.S. and UK.
What this means for you: inventory positioning is critical. Stockouts hurt more than ever when customers expect same day. FBA sellers benefit automatically. FBM sellers need 3PL partners capable of rapid fulfillment.
Rufus: The Biggest Change in Product Discovery Since Search
Amazon’s shopping assistant Rufus generated $12 billion in incremental sales in 2025. That exceeded their $10 billion projection.
300+ million customers used Rufus. Monthly active users grew 149% year over year. Interactions jumped 210%.
Here’s the stat that should change how you think about listings. Customers who engage with Rufus are 60% more likely to complete a purchase.
By October 2025, Rufus handled 274.3 million daily queries. That’s 13.7% of all Amazon searches. Projections suggest it could hit 35% by end of 2026.
The financial trajectory is aggressive:
- 2024: ~£285 million operating loss (investment phase)
- 2025: Expected £700 million in operating profits
- 2027: Projected £1.2 billion in operating profits
What you need to do:
- Optimize listings for natural language questions, not just keywords
- Focus on detailed descriptions, accurate categorization, quality images
- Traditional keyword stuffing won’t work anymore. Content quality matters.
- Sellers who optimize properly see 20 to 25% sales increases
More than 1.3 million sellers are now using Amazon’s tools for listings. If you’re not, you’re falling behind.
Other Tools You Should Know About
Amazon Nova Suite:
- Nova Sonic: Voice tool for customer service
- Nova Act SDK: Website helper for automated tasks
- Nova Premier: Complex tasks like coding and document review
Alexa+ for Shopping:
- Better voice shopping with context understanding
- Can complete purchases and manage orders
- Free for Prime members
- Customers engage 2x more than original Alexa
- 4x more shopping conversations end in purchase
Interests Feature:
Helps customers find products based on hobbies, giving sellers new discovery opportunities beyond keyword targeting.
Pricing Sweet Spot: $16 to $50
| Product Price Range | Percentage of Amazon Sellers |
|---|---|
| Under $5 | 4% |
| $6 to $10 | 9% |
| $11 to $15 | 16% |
| $16 to $20 | 18% |
| $21 to $25 | 16% |
| $26 to $30 | 15% |
| $31 to $50 | 13% |
| $51 to $100 | 5% |
| $101+ | 1% |
| Varying product prices | 3% |
62% of sellers price between $16 and $50. Customers are generally comfortable spending up to $50 per purchase.
Too low and margins disappear. Too high and conversion drops. Find your sweet spot in that $16 to $50 range if possible.
Top Categories: Where the Money Is
Beauty and personal care: 30% of total sales. High repeat purchase rate. Strong female audience. Mix of established brands, DTC, and retail sellers.
Home and kitchen: 30% of top selling products. Primarily one time purchases. Category sits between growth and peak phases.
Fashion and accessories: 27% share. Fastest growing category. Could hit #1 in the next few years. Trends are dynamic, demand never wears out.
Customer Priorities (In Order)
- Free Shipping (44%)
- Quick Delivery (38%)
- Product quality and reviews
Customers will compromise on many things, but not delivery speed. Partner with FBA or a quality FBM provider, or consider seller flex amazon models that combine warehouse control with Amazon’s delivery network. Build shipping costs into your pricing if needed. Sometimes sacrificing margin for customer experience pays off long term. hipping charges. In some cases, compromise on profit margin to enhance customer experience.
Amazon’s $200 Billion 2026 Investment
In the Q4 2025 earnings call, Andy Jassy announced approximately $200 billion in planned capital expenditure for 2026. That’s the largest annual investment in company history, up from $131.8 billion in 2025.
Where the money’s going:
Technology Infrastructure: Trainium and Graviton chip scaling, Project Rainier (world’s largest computing cluster with 500,000+ Trainium2 chips), Nova platform expansion globally
Fulfillment Network: New fulfillment centers, same day delivery expansion from 1,000+ to 2,300+ cities, rural delivery infrastructure (60% increase in 2025), cold storage facilities for grocery
Global Connectivity: Project Kuiper satellite internet, international marketplace infrastructure, cross border fulfillment simplification, Middle East and Asia Pacific expansion
This investment benefits sellers directly. Faster delivery, better tools, more fulfillment options.
Key Revenue Metrics Summary (Full Year 2025)
| Revenue Stream | Full Year 2025 | YoY Growth |
|---|---|---|
| Total Net Sales | $638.0B | 0.10 |
| North America | $373.0B | 0.09 |
| International | $159.6B | 0.07 |
| AWS | $105.4B | 0.17 |
| Third Party Services | $184.1B | 0.13 |
| Advertising | $54.0B | 0.23 |
| Subscription Services | $44.3B | 0.11 |
Frequently Asked Questions
Should I choose FBA or FBM?
78% of sellers prefer FBA for Prime eligibility and convenience. 34% use FBM for cost control. 22% use both, and that’s what I recommend. FBA delivers 5.2x better first year earnings. But with Amazon eliminating prep services in March 2026, you’ll need a 3PL partner regardless.
How much should I spend on Amazon advertising?
30 to 40% of product revenue for established products. Start at 20 to 25% for new launches. Optimize based on ACoS and scale what works. Advertising is no longer optional. It’s cost of doing business.
How long until I’m profitable?
58% of sellers achieve profitability within 12 months. 22% make it in under 3 months. Focus on customer ratings, fast delivery, and winning the buy box to accelerate your timeline. But know that 22% never become profitable. Product selection and operational efficiency matter.
What are the most profitable categories?
Beauty and personal care (30% of sales) offers repeat purchases. Home and kitchen (30%) provides steady demand with higher margins. Fashion and accessories (27%) is the fastest growing with dynamic opportunities.
How is Rufus changing Amazon selling?
Rufus reached 300M+ users with 60% higher purchase rates. 1.3 million sellers now use Amazon’s tools for listings. Traditional keyword stuffing is dead. Content quality matters now. Optimize for natural language questions. Sellers who optimize properly see 20 to 25% sales increases.
How many sellers are on Amazon now?
Approximately 1.65 million active third party sellers (down from 2.4 million in 2021), out of 9.7 million total registered accounts. Fewer sellers means more opportunity per seller. Traffic per active seller increased 31% since 2021.
What Role Does Amazon BSR Data Play in Understanding Marketplace Seller Statistics?
BSR sales estimators convert rankings into actual sales estimates, revealing that products with BSR under 10,000 typically represent the top 1-3% of sellers by volume. This helps you set realistic expectations, benchmark performance, and identify categories offering the best opportunities.
What’s the Amazon seller success rate?
64% become profitable within 12 months. 46% achieve 11 to 25% profit margins. However, 22% never become profitable and approximately 20% exit within their first year. Success depends on product selection, fee management, and operational efficiency.
What role does Rufus play in product discovery?
Rufus handles 274M+ daily queries (13.7% of Amazon searches). Users are 60% more likely to purchase. Optimize with detailed descriptions, accurate categorization, and quality images. Projections suggest Rufus could handle 35% of search volume by end of 2026.

Arishekar N is a Vice President (VP) of Marketing at AMZ Prep, specializing in ecommerce fulfillment and Amazon logistics strategies with a proven track record of driving growth for e-commerce businesses. He is a strategic leader with extensive expertise in marketing, e-commerce operations, SEO & advertising, and branding.
Stay updated on his latest insights by following him























I didn’t realize the US still accounts for over 60% of seller activity—great context.
The insight into startup capital and seller motivations was spot on!
Would be cool to get a PDF version of this tons of value here.
These stats really helped me shape my pitch deck for Amazon brand partnerships.
The seller profit margin breakdown was especially helpful for setting realistic goals.
Really interesting to see how many sellers are now expanding into Walmart Marketplace too.
Love that you updated this for 2024 most blogs are still stuck with 2022 numbers.
I had no idea 73% of sellers are using FBA—this data is super insightful.
The failure rate stat is a good reminder of how competitive the marketplace is.
Love the clean layout makes digesting all these stats a breeze.
I guess PPC optimization is absolutely necessary now. Can’t take any chances as far as sellers are concerned.
It’s crazy to think that only 839,900 brands are now registered on Amazon! I expected more
I didn’t realize private label products had such a strong niche on Amazon. It’s something I’d like to explore further.
I wonder how inflation might impact these seller statistics next year.
AMZ Prep is the way to go. This is blog is very convincing. I hadn’t considered the importance of using a 3PL for FBM sellers before.
It’s surprising as well as not that beauty and personal care dominate with 30% of sales. Guess, recurring purchases are the goldmine!
I’m surprised 58% of sellers become profitable within 12 months. It’s a good period It’s shorter than I expected!
$16 to $50 is indeed a sweet spot for many categories! But I would say $14 to 45$ would have made sense also.
Great insights! Interesting so, third-party sellers now account for 61% of Amazon’s total sales.
The mention of Subscribe and Save having a 1.8% conversion rate is a great takeaway