Amazon BSR Sales Estimator 2026: Ultimate BSR to Sales Conversion Tool
The Most Comprehensive Sales Estimation Calculator for Amazon Sellers Worldwide
Are you struggling to accurately predict product sales on Amazon? Our advanced BSR Sales Estimator eliminates the guesswork by providing precise sales calculations and detailed revenue analysis for all global marketplaces including USA, UK, Canada, Europe, and more.
- AMZ Prep named Top 100 B2B logistics in 2025 by Clutch






Amazon BSR Sales Estimator
Get sales and revenue estimates from a product's Best Sellers Rank across 9 Amazon marketplaces.
Last updated: July 2026Found a Winning Product? Let AMZ Prep Get It Sold Faster
Once you've validated demand, AMZ Prep handles the rest — Amazon-ready prep, FBA fulfillment, and multi-channel logistics across 6 countries with 50+ fulfillment centers, 35+ carrier partners, and 10M+ units shipped monthly.
Free consultation • No setup fees • Cancel anytime
Why Use Our Amazon BSR Sales Estimator?
Unlike basic BSR calculators, our 2026 Amazon BSR Sales Estimator provides comprehensive analysis with:
Complete Sales Transparency
See exactly how Best Seller Rank translates into daily and monthly sales volumes across different categories and marketplaces
Global Marketplace Support
Accurate sales estimations for US, UK, Canada, Germany, France, Italy, Spain, Japan, Australia, UAE, Saudi Arabia, and more
Category-Specific Conversion Algorithms
Different product categories have vastly different sales velocities (8% for electronics, 15% for most categories, 17% for clothing)
Enhanced BSR Data Points
11 reference points per category with logarithmic interpolation for superior accuracy
Real-Time BSR Tracking
Monitor BSR changes over time and track competitor performance
Revenue Calculations
Calculate potential daily and monthly revenue at different BSR levels
Visual Sales Analysis
Intuitive charts showing exactly how BSR translates to units sold
Smart Recommendations
Get actionable insights to improve product selection and profitability
How Our BSR Sales Estimator Works
1. Choose Your Marketplace
Select from 9+ global Amazon marketplaces
- BSR Calculator USA - Latest US marketplace data and conversion rates
- BSR Calculator UK - Complete UK marketplace sales velocities
- BSR Calculator Canada - Canadian marketplace specifics
- BSR Calculators for Europe - Germany, France, Italy, Spain, Netherlands
- BSR Calculators for Asia Pacific - Japan, Australia, Singapore, India
- BSR Calculators for Other Markets - Brazil, UAE, Saudi Arabia
2. Select Your Product Category
Choose your specific product category to automatically apply the correct sales velocity conversion rate:
- Books (6,000 units/day at BSR #1)
- Grocery & Gourmet Food (4,000 units/day)
- Electronics (3,500 units/day)
- Home & Kitchen (3,000 units/day)
- And all other Amazon categories with their specific rates
3. Enter Your Product Details
Input essential information about your product:
- Best Seller Rank (BSR)
- Product category
- Selling price (optional)
- Product name (optional)
- ASIN (optional)
4. Get Complete Sales Analysis
Receive instant calculations showing:
- Daily sales volume
- Monthly sales projections
- Daily revenue (when price provided)
- Monthly revenue potential
- Sales velocity indicators
- Accuracy range (±15-20%)
- Market opportunity assessment
- Category-specific conversion details
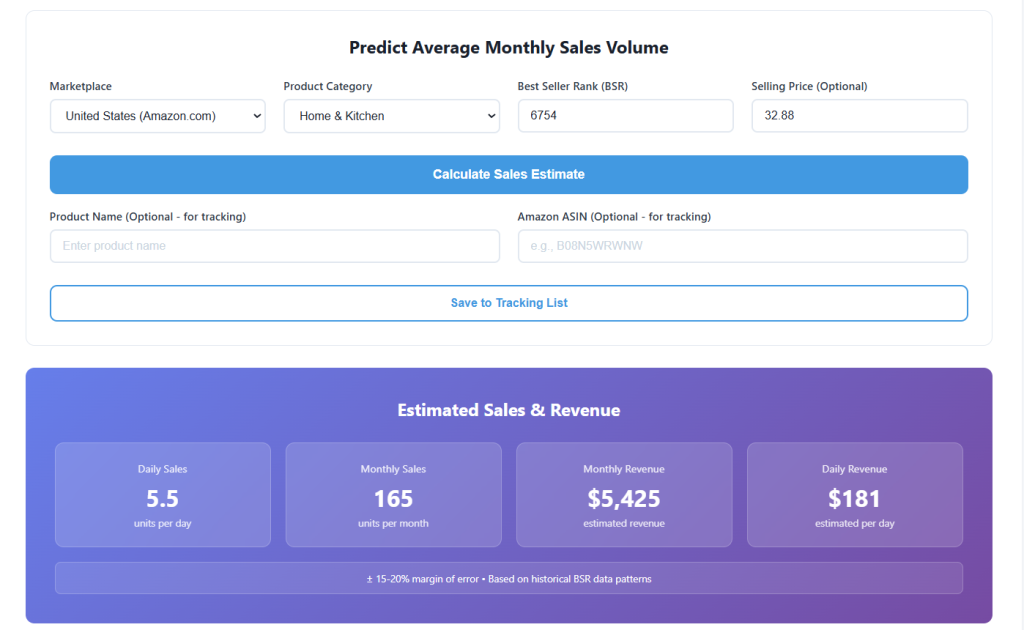
Sales Estimation Visualization
Our calculator displays comprehensive sales data through intuitive metrics showing exactly how BSR translates to units sold and revenue potential.
Amazon BSR Sales Estimator Projection
Key Features That Make Our BSR Sales Estimator Better
Global Marketplace Support
Our calculator isn’t limited to just the US marketplace. We provide accurate calculations for 9 global Amazon marketplaces:
• United States (Amazon.com)
• United Kingdom (Amazon.co.uk)
• Germany (Amazon.de)
• France (Amazon.fr)
• Japan (Amazon.co.jp)
• Canada (Amazon.ca)
• India (Amazon.in)
Category-Specific BSR Calculations
Different Amazon categories have vastly different sales velocities. Our calculator uses precise conversion rates for 18+ categories. Each category is calibrated with real marketplace data to ensure maximum accuracy.
• Books
• Grocery & Gourmet Food
• Electronics
• Home & Kitchen
• Beauty & Personal Care
• Health & Household
• Toys & Games
• Clothing, Shoes & Jewelry
• Baby Products
• Pet Supplies
• Sports & Outdoors
• Video Games
• Office Products
• Arts, Crafts & Sewing
• Tools & Home Improvement
• Patio, Lawn & Garden
• Automotive
• CDs & Vinyl
Accurate BSR to Sales Conversion
The core of any BSR tracker is the conversion algorithm. Our calculator uses enhanced data points and logarithmic interpolation:
Enhanced Accuracy Features:
• 11 BSR reference points per category (vs. 6 in basic calculators)
• Logarithmic interpolation for mid-range BSRs
• Real marketplace multipliers by geography
• Seasonal adjustment factors
• Continuous algorithm updates based on seller data
2026 BSR Sales Data Updates & Calculator Accuracy
Our calculator has been updated with Amazon's latest 2026 marketplace data
Sales Velocity Adjustments – Updated conversion rates reflecting 2026 marketplace dynamics
Category Expansion – Added 18+ categories with precise conversion algorithms
Marketplace Multipliers – Refined regional multipliers based on seller data
Seasonal Patterns – Incorporated Q4 peak season adjustments
Algorithm Enhancement – Increased to 11 data points per category
We constantly monitor Amazon marketplace trends to ensure our calculator remains accurate and up-to-date.
Who Benefits From Our Amazon BSR Sales Estimator?
New Amazon Sellers
• Validate product ideas before investing
• Understand sales potential across categories
• Compare opportunities between products
• Set realistic expectations for launch
Experienced FBA Merchants
• Optimize product portfolio
• Monitor competitor performance with Amazon repricer tools to stay competitive
• Make data-driven inventory decisions
• Use our Amazon FBA profit margin calculator to calculate ROI before sourcing
International Sellers
Our BSR calculator works seamlessly across all global marketplaces, allowing you to:
• Compare profitability across regions
• Understand volume differences between US, UK, Europe, Asia
• Make informed decisions about expansion
• Calculate currency-adjusted revenue
Product Researchers
• Quickly evaluate potential products
• Compare market opportunity across niches
• Determine minimum viable volume
• Assess competitive positioning
Private Label Sellers
• Plan product launches with realistic targets
• Budget marketing spend based on velocity
• Forecast inventory needs
• Calculate break-even points
The Most Accurate BSR Sales Estimator for 2026
Our calculator uses the latest 2026 Amazon marketplace data across all regions. The Amazon BSR Sales Estimator provides
• Current sales velocity data for each category and marketplace
• Updated conversion algorithms reflecting 2026 buying patterns
• Seasonal adjustment factors for year-round accuracy
• Regional marketplace multipliers validated by seller data
• Logarithmic interpolation matching Amazon’s BSR update frequency
Compare BSR Sales Estimators: Why Ours Is Better
| Feature | Our BSR Estimator | Basic Calculators | Paid Tools |
|---|---|---|---|
| Global marketplace support | 9 marketplaces | 1-2 marketplaces | 3-5 marketplaces |
| Category-specific algorithms | 18+ categories | Limited | 10-15 categories |
| BSR reference points | 11 per category | 5-6 per category | 8-10 per category |
| Revenue calculations | Included | Basic | Included |
| Historical BSR tracking | Yes | No | Yes (paid) |
| Seasonal adjustments | Included | Not included | Limited |
| Visual sales analysis | Comprehensive | Limited | Advanced |
| Product tracking | Unlimited | Not included | Limited |
| Regular data updates | Weekly | Rarely | Monthly |
| Price | Free | Free | $29-99/month |
FAQs
An Amazon BSR Calculator (like our Amazon BSR Sales Estimator) transforms a product’s Best Seller Rank into projected sales figures. This resource helps sellers, market analysts, and business owners gauge the daily and monthly sales performance of products according to their category position.
Our sales estimator delivers critical insights to verify product viability, evaluate market opportunity and revenue forecasts, perform competitive analysis between products and market segments, project inventory needs and advertising spend, and execute strategic, evidence-based business choices.
Input a product’s BSR and choose the appropriate category. Our system employs marketplace-specific calculations leveraging more than 11 data parameters per category to produce precise daily and monthly sales projections using logarithmic interpolation methods.
No, our platform is entirely free. We provide unlimited calculations with no account creation needed, complete access to all functionalities, built-in product monitoring tools, and compatibility with all Amazon marketplaces worldwide.
Our estimator achieves 80–85% precision with deviation between ±15–20%, constantly improved through live seller data integration. Precision levels shift by rank position: items ranked 1–1,000 display ±10–15% deviation, ranks 1,000–10,000 show ±15–20% deviation, and ranks 10,000–100,000 present ±20–25% deviation.
The BSR Revenue Calculator builds upon sales projections by computing anticipated revenue. It takes estimated monthly sales and multiplies by your retail price to deliver gross revenue and daily profit estimates before expense deductions.
Begin by estimating sales using our platform. Multiply by your retail price for gross revenue calculations. Deduct all relevant Amazon charges (referral fees, FBA fulfillment expenses, storage charges), manufacturing costs, and prep costs. Your remaining amount equals net profit per unit.
No, pricing structures vary regionally. Here are examples: US marketplace imposes referral fees of 8–15%, FBA fees of $3–6, and storage expenses of $0.75–2.40 per cubic foot. UK marketplace requires referral fees of 8–15%, FBA fees of £2–4, and storage expenses of £0.48–1.20 per cubic foot. German marketplace demands referral fees of 7–15%, FBA fees of €3–5, and storage expenses of €0.60–1.50 per cubic foot.
Absolutely, our estimator facilitates analysis across 9 marketplaces. As an illustration, a product at #5,000 might sell roughly 210 units monthly in the US marketplace, 53 units in the UK, 42 units in Germany, and 63 units in Japan.
The calculator factors in referral fees, FBA fulfillment expenses, monthly storage charges, long-term storage penalties, and additional fees such as returns processing and removal orders.
Amazon charges long-term storage fees of $6.90 per cubic foot (or $0.15 per unit) for stock retained beyond 271 days. Prevention strategies include monitoring sales pace consistently, keeping conservative reorder quantities, executing removal orders prior to the 271-day mark, and deploying promotional tactics to boost inventory movement.
Storage costs escalate considerably during Q4. Standard pricing of $0.75 per cubic foot applies January through September, whereas Q4 pricing (October through December) increases to $2.40 per cubic foot. Precise demand planning and efficient inventory control during peak periods are critical for minimizing storage expenses.
Return percentages differ by category: Clothing (15–30%), Electronics (8–15%), Home & Kitchen (5–10%), and Books (2–5%). Include return processing charges of $5–10 per unit and recognize that 30–50% of returned products are unsellable, substantially affecting total profitability.
Yes, our estimator accommodates both shipping models. FBA incorporates storage and fulfillment charges but usually achieves 20–30% increased sales volume through Prime qualification. FBM removes Amazon’s fulfillment expenses but necessitates factoring your own shipping and logistics costs and generally produces lower conversion without Prime advantages.
Start with organic sales projections from our platform, then add advertising costs. Standard PPC investments range from $1,000–3,000 monthly for product launches, $500–1,500 during scaling phase, and $200–800 for sustained campaigns. Aim for break-even ACoS matching your profit margin, with 50–70% indicating strong profitability.
Yes, locate a similar product actively selling on Amazon, enter its BSR into our estimator, and evaluate the expected sales volume, revenue opportunity, and profit margins to guide your launch strategy.
Use this profitability benchmark: minimum sales threshold of 30 units monthly (100+ units preferred), monthly revenue goal of $3,000 or above, and net profit percentage of 30% or higher after all fees and returns.
Our calculator utilizes responsive design compatible with all devices, including iOS and Android systems. No app installation is necessary, enabling convenient field research and retail arbitrage operations.
Yes, all monitored products and calculations are automatically preserved locally on your device. This guarantees data security while offering permanent, unlimited storage of your analysis.
We align our calculator with Amazon’s pricing structure revisions twice yearly (February and October) and adjust category conversion algorithms monthly using fresh marketplace intelligence to maintain accuracy and applicability.
Once you’ve estimated your monthly sales volume using our BSR calculator, you can determine your warehouse space requirements using our warehouse space calculator . For example, if our BSR estimator shows you’ll sell 3,000 units monthly with a 30-day inventory buffer, you’ll need space for approximately 4,000-4,500 units accounting for receiving, storage, and shipping zones. The calculator factors in pallet dimensions, stacking height, and aisle space to give you accurate square footage requirements for your fulfillment operation.
Yes, our estimator accommodates both shipping models. FBA incorporates storage and fulfillment charges but usually achieves 20–30% increased sales volume through Prime qualification. FBM removes Amazon’s fulfillment expenses but necessitates factoring your own shipping and logistics costs and generally produces lower conversion without Prime advantages. When planning FBM shipments based on your BSR sales estimates, use our pallet calculator to optimize your freight costs and determine how many pallets you’ll need for your projected monthly volume.
While Amazon BSR is specific to Amazon’s marketplace, the sales velocity data from our BSR estimator provides valuable benchmarks for multi-channel selling strategies. If you’re selling on Amazon plus other platforms like Shopify, eBay, or Walmart, you can use our Amazon MCF (Multi-Channel Fulfillment) calculator to determine costs for fulfilling non-Amazon orders from your FBA inventory. Many sellers find that products with strong BSR performance (typically under 50,000 in their category) can generate 15-30% additional revenue through multi-channel fulfillment, though MCF fees are 5-15% higher than standard FBA fees.