Middle Mile Audit Tool

Free — No Credit Card Required

Your Amazon Inbound Is Costing
More Than You Think

1
Watch Demo
2
Get Extension
3
Upload Files
4
Get Scorecard

Hit play. Then upload 3 Seller Central reports to see real savings. Get your free scorecard in minutes.

0s
Unlock the Full Demo
Enter your details to continue watching
Watch full demo  ·  See and learn how to use this middle mile tool
See Real ResultsWatch how brands cut inbound times from 30 days to under 5
Platform WalkthroughFull demo of our proprietary rating technology
VIP Lane AccessLearn how load consolidation gets you priority
Exclusive Partner Content
1.8avg days dock-to-dock
75%faster inbound
$100K+avg annual savings
Free Chrome Extension

One-Click Export From
Seller Central

Our extension pulls the exact 3 reports needed for your placement fee analysis — no manual navigation, no formatting headaches.

★★★★★ 5.0  ·  170+ Amazon sellers
Icon Add to Chrome — It's Free

Upload Your 3 Reports

Use the Chrome extension in Seller Central, then upload each file below

FBA Shipment Export
FBA shipment data with units, dates, and destinations
FBA Placement Fees
Placement fees for each FBA shipment
Monthly Storage Fees
Product classifications and hazmat information
How to Upload

Upload FBA Shipment, Placement Fees, and Monthly Storage files (.xlsx or .csv format) step-by-step for better accuracy.

Almost There — Get Your Free Scorecard

We'll analyze your data and email results within 24 hours

Most Brands Don't Know What Their Inbound Is Actually Costing Them

Placement fees, slow check-in times, and freight costs don’t show up in one line. They’re spread across three different Seller Central reports.

The average brand we analyze averages 14 to 36 days to get stock into Amazon. Some are spending over $370,000 a year on inbound. Most have no idea until they see the numbers side by side.

The Amazon Inbound Fee Scorecard pulls those numbers together. You get a clear picture of your current costs and where the savings are.

Organic Social Proof

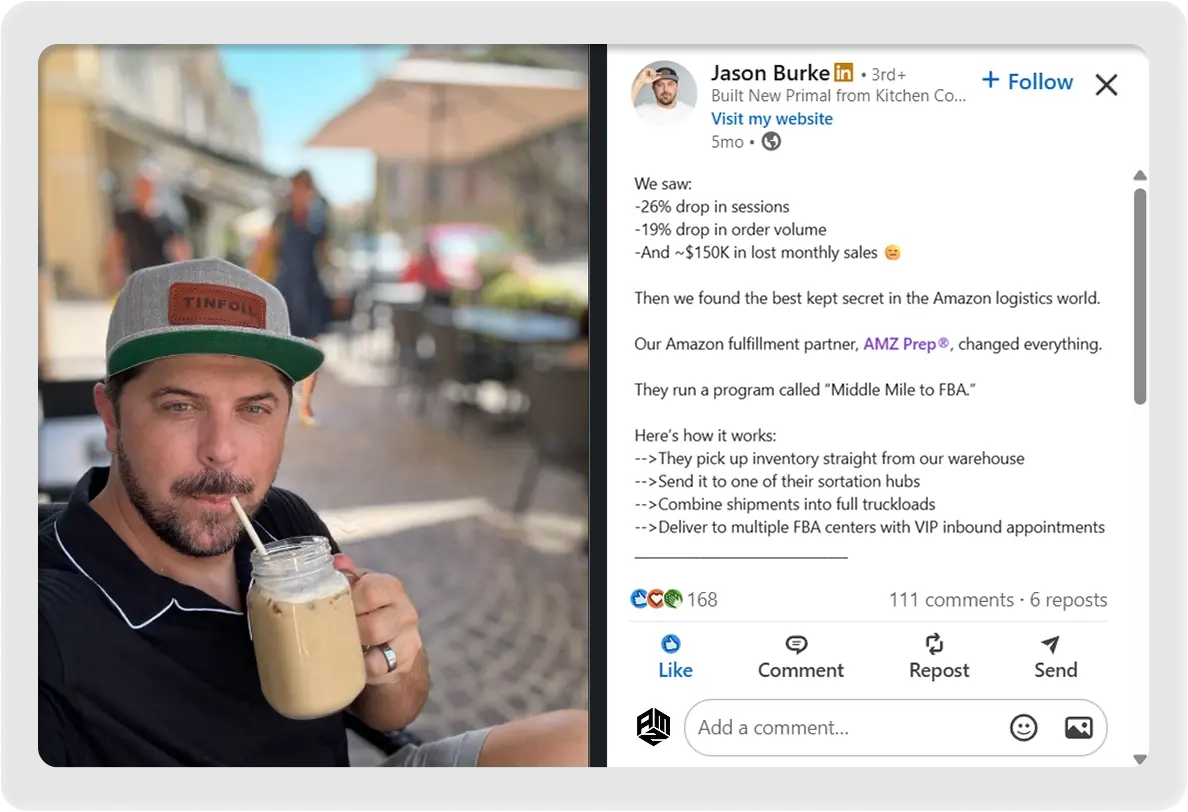
"Jason from New Primal posted about his inbound speed challenges publicly. It was completely organic. They were using us to get stock into Amazon faster, cut costs, and reduce placement fees."

— Blair Forrest, Founder, AMZ Prep

What Brands See When They Run the Analysis

Pet Brand

$100K+

Saved. 18-day average inbound. $372K in annual spend analyzed. 1.3M items shipped. Inbound time cut 75%.

Muscle Mac

50%

Cost Reduction. 36 days to 2-5 days inbound. 80% prime eligible within 7-10 days.

New Primal

Zero

Placement fees. Using AMZ Prep middle mile to stock Amazon faster and eliminate placement charges entirely.

How It Works — Four Steps, Under 10 Minutes

1

Watch the 30-Second Preview

Blair walks through an actual merchant analysis — 1.3M items, $372K inbound spend. Watch before uploading anything.

Form gate after 30s — unlock full 7-min demo
2

Install the Free Chrome Extension

One click per report. Pulls FBA Shipment Export, Monthly Storage Fees, and FBA Placement Fees directly from Seller Central. Rated 5.0 by 170+ sellers.

Link to Chrome Web Store
3

Upload Your 3 Reports

Drag and drop the three exported files. Under 2 minutes. Our proprietary rating system analyzes inbound speed, storage fees, and placement charges automatically.

Upload form — existing component
4

Get Your Scorecard + Book a Strategy Call

Full cost breakdown emailed within 24 hours. A fulfillment specialist walks you through the numbers on a free 30-minute call. No pressure — just data.

Calendly or calendar embed

One Report. Three Things That Actually Move the Needle.

1.8

Inbound Speed Score

Days from your facility to Amazon check-in. AMZ Prep averages 1.8 days dock-to-dock outside Q4.

75%

 Total Placement Fee Spend

The exact dollar amount Amazon charged in placement fees over the last 12 months.

1.8

Your Savings Estimate

What you could save in fees and freight. One brand saved $100K+ without changing anything else.

What Amazon Sellers Say About AMZ Prep

Brands across the US and Canada trust AMZ Prep to simplify inbound logistics and uncover hidden savings in their middle mile.

Questions We Get Before Brands Run the Analysis

Is this free?

Yes. The scorecard, Chrome extension, and strategy call are all free. No commitment required.

See Your Numbers. No Commitment.

170+ Amazon sellers have already run their analysis.

The average result shows $100K+ in annual savings potential.